Algorithm-Result Worksheets
Having reviewed the summary worksheets, select the tabs to related algorithm-result worksheets for detail you need to resolve issues. Each algorithm-result worksheet provides up to 5,000 records generated by its algorithm.
Access Algorithm Results
In the worksheet for an access algorithm, each row is a record of an access assignment to a user that the algorithm defines as risky. More often than not, a single access conflict involves assignments documented in more than one row. As you review results, you'll encounter some specialized terminology:
-
An access point is any job role, duty role, or privilege. An access algorithm defines conflicts between access points. An Access Point column identifies the access point that's the focus of a result record, and an Access Point Type column indicates whether it's a privilege or a role.
-
An Incident Information column reports the path to the access point that's the focus of the result record. (Paths to access points are defined by hierarchies established in your job and duty roles.)
-
An access entitlement is a set of related access points. An algorithm may (and typically does) define conflicts between entitlements. If so, each access point in one entitlement conflicts with every access point in the other. An Access Entitlement Name column identifies the entitlement to which the Incident Information access point belongs.
-
A Role column identifies the role that provides access to the Incident Information access point.
-
User Name, First Name, and Last Name columns identify the user whose role assignments contain conflicts.
Often, an efficient way to review an access worksheet is to use it as the source of a pivot table, which can arrange data to emphasize what you want to see. The following examples illustrate the use of pivot tables. Complete these preparatory steps before creating pivots from access-algorithm worksheets:
-
Remove any rows above the column-header rows.
-
Select all remaining rows: Click on the triangle icon in the upper left corner (between the letter A that labels the first column and the number 1 that labels the first row).
Access Examples: Intrarole Risk
To begin an intrarole-risk investigation, review the Intrarole Access Risks summary worksheet. It may contain records of analysis by two types of algorithm.
The first type detects sensitive access: A role may include individual privileges whose assignments are worthy of review because each provides broad access. These algorithms include the word "sensitive" in their names. For each of these algorithms that a role has violated, open the algorithm-result spreadsheet. In it, each record identifies a sensitive access point, the role that contains it, and a user assigned the role. You may remove the role from a user who doesn't need its sensitive access. More commonly, the user requires the sensitive access, but should be monitored.
The second intrarole-algorithm type detects occasions when a role on its own grants privileges that conflict with one another. The name of each of these algorithms consists of the names of two entitlements containing access points that would enable users to perform conflicting actions. For each algorithm that a role has violated, open the algorithm-result worksheet and create a pivot table based on these three values:
-
Role: This identifies the role in which a conflict exits.
-
Access Entitlement Name: Any role associated with two entitlements necessarily has an intrarole conflict. (The pivot table is likely to include records in which a role is associated with one entitlement. They apply to user-access-risk conflicts, so you can ignore them as you investigate intrarole conflicts.)
-
Incident Information: These records identify paths to access points that conflict within the role. Each path belonging to one entitlement conflicts with every path belonging to the other entitlement.
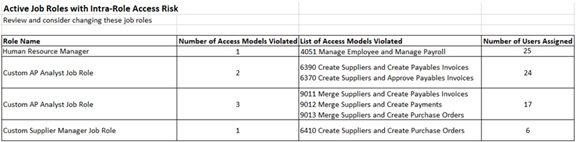
For example, suppose the Intrarole Access Risks summary worksheet contains four rows that identify job roles with intrarole conflicts. One of them, Human Resource Manager, violates an algorithm called Manage Employee and Manage Payroll. The role is assigned to 25 people. This role is listed first in the following illustration.
Open the result worksheet for that algorithm (click on the tab labeled with its name), create the pivot table, and search on the role name. You'll find a set of records that looks like this:
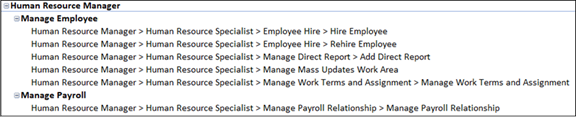
In this example, the one path belonging to the Manage Payroll entitlement conflicts with each of the five paths belonging to the Manage Employee entitlement.
You might decide that the number of affected users is large enough that you should redesign the role to eliminate its conflicts. In this example, you might use the Security Console to remove the one access point that conflicts with all the others: Manage Payroll Relationship.
Or, suppose that the number of users had been smaller and that, having identified those users, you realize they require the conflicting access to do their jobs. You might choose to leave the role as it is, monitor those users regularly, and prevent the role from being assigned to users who don't need its conflicting access.
Then follow the same process to resolve conflicts in any remaining roles. (There are three in this example.) Use the Intrarole Access Risks summary worksheet to identify a suspect role and the algorithms it's violated. Open the worksheet for each algorithm, create the pivot table, and search for the role. Note, though, that if you've already created a pivot table for an algorithm as you cleaned up conflicts in another role, you can reuse that pivot table.
Access Example: User-Access Risk
To begin investigating user-access risk, review the User Access Risks summary worksheet. For each user with role-assignment conflicts, identify the algorithms that define those conflicts. Open the worksheet for each algorithm, and create a pivot table based on these three values:
-
User Name: This identifies a user assigned roles that combine to violate access algorithms.
-
Role: This identifies the roles that potentially conflict.
-
Access Entitlement Name: This names entitlements containing access points that in combination may violate access algorithms. Sometimes, a role may be associated with two entitlements, which indicates an intrarole conflict. To remove that "noise," it's recommended that you clean up intrarole conflicts before you investigate user-access conflicts. Then, each role in the pivot table for user-access risk typically lists a single entitlement. Conflicts exist between roles associated with one entitlement and roles associated with any other entitlements.
For example, suppose the User Access Risk summary worksheet contains a row stating that a user named Luisa Miller is assigned roles that violate the Manage Employee and Manage Payroll algorithm. (Once again, the algorithm name identifies two entitlements whose access points conflict.)
Open the result worksheet for that algorithm, create the pivot table, and search for the user name. You'll find a set of records that looks like this:
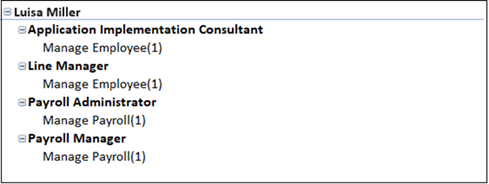
Each role associated with one entitlement conflicts with every role associated with the other entitlement. In this example, there are four conflicts: Application Implementation Consultant with Payroll Administrator, Application Implementation Consultant with Payroll Manager, Line Manager with Payroll Administrator, and Line Manager with Payroll Manager.
Your typical recourse is to rescind the user's access to one of the roles in each conflict. In this example, you would use the Security Console to remove either Application Implementation Consultant and Line Manager, or Payroll Administrator and Payroll Manager. Another option is to create customized versions of the two roles you would otherwise take away. Each custom role would remove a conflicting access point, but retain other access rights.
Transaction Algorithm Results
In the worksheet for a transaction algorithm, each row is the record of a transaction that violates the algorithm, although a single violation may encompass multiple rows. For example, an algorithm that detects duplicate invoices would return one row for each of the duplicated invoices.
Records may contain the following information:
-
Most columns report values for attributes of business objects. A business object is a set of related fields in a business application subject to analysis by an algorithm. An attribute is one field in the set. However, every transaction algorithm is assigned its own result attributes, so the result worksheet for each algorithm contains a unique set of columns.
The header for each of these columns concatenates the name of a business object with the name of one of its attributes, with a period as the delimiter. For example, "Supplier.Supplier Name" indicates the Supplier Name attribute of the Supplier business object. In this example, the value reported for each record would be the name of a supplier.
-
Attributes include key values, such as supplier number or invoice number, that you can use to search for records of suspect transactions in the applications in which they were created. These attributes are located in the first few columns of an algorithm-detail worksheet. They vary from algorithm to algorithm.
-
Algorithms may use filters that divide records into groups. In each group, specified values are either equal or similar to one another. The records in each group constitute a set of transactions that may present an issue. For example, an algorithm may group invoice records by supplier, to determine whether invoice amounts for each supplier exceed a limit, or perhaps an average amount.
When an algorithm creates groups, columns report the values that are equal or similar to one another. Their headings include the phrase "is the same" or "is xx percent similar" (in which xx is a number). They're among the last few columns in the worksheet. Also, each worksheet includes an algorithm description, which you're encouraged to read not only to understand what the algorithm sets out to find, but also to identify significant features such as grouping values.
-
A transaction algorithm may incorporate "derived attributes." These are calculations performed by the algorithm. For example, the algorithm that groups invoice records by supplier may calculate the total value, or the average value, of invoices for each supplier. For each record in the group, a column reports the calculated value.
Some algorithms find transactions in each of which an individual user has acted in a way that violates sound separation-of-duties policy. Others find transactions that show signs of any sort of risk other than SOD risk. The type of an algorithm may influence how you review its results.
The name of each transaction algorithm begins with a five-digit code. You can use the first two digits of each code to distinguish the type of algorithm as well as the business process to which it applies:
| Code Begins With | Algorithm Type |
|---|---|
| 30 | Non-SOD analysis in the Accounts Payable process |
| 32 | Non-SOD analysis in the General Ledger process |
| 33 | Non-SOD analysis in the Order to Cash process |
| 40 | SOD analysis in any of the Accounts Payable, General Ledger, or Order to Cash processes |
| 50 | SOD and non-SOD analysis in the Human Capital Management process |
Transaction Example: SOD Risk
Algorithms may review transactions for separation-of-duties risk. Each specifies actions that may conflict, such as managing suppliers and creating payables invoices for those suppliers, and identifies users who have created or updated records of those actions.
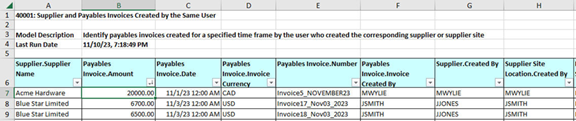
In the result worksheet for one of these algorithms, each row is in itself a complete risk incident. For example, suppose the Transaction Risk Summary worksheet contains a row for an algorithm titled 40001: Supplier and Payables Invoices Created by the Same User. It indicates that algorithm violations exceed $100,000 and that the worksheet includes 56 result rows. For this type of algorithm, there are therefore 56 individual issues for you to investigate.
You open the result worksheet for the algorithm. Its description tells you that each row identifies users who have created both a payables invoice and a record of the corresponding supplier or supplier site. You might want to begin by sorting on the Payables Invoice.Amount column, so that you can start with the highest-value issue and descend from there.
You would then look for "Created By" columns. (Some SOD algorithms also include "Last Updated By" columns.) In this algorithm, the columns identify users who created supplier records, payables invoice records, and supplier-site location records. In the row for a particular supplier, you would discover the identity of an individual user who has created all three of these records, or two of the three. You could then investigate the related record numbers and follow up with that user to determine that the actions were legitimate.
Transaction Examples: General Risk
Algorithms may review transactions for risks other than separation of duties. Broadly, these algorithms come in two types.
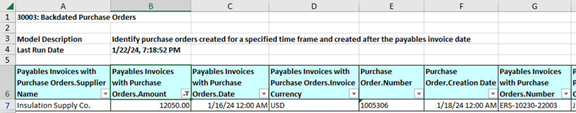
For one type, each row in the result worksheet for an algorithm is by itself a complete risk incident. For example, suppose the Transaction Risk Summary worksheet contains a row for an algorithm titled 30003: Backdated Purchase Orders. It indicates that algorithm violations amount to more than $80,000 and that its worksheet includes 35 result rows. For this algorithm type, there are therefore 35 individual issues for you to investigate.
You open the result worksheet for the algorithm. Its description tells you that each row documents a purchase order created for a time period that comes after its payables invoice date. Each record provides a supplier name, purchase order number, creator of the purchase order, and other information you can use to investigate the issue. Your first step may be to sort on its Payables Invoices with Purchase Orders.Amount column; this enables you to focus on high-value issues first.
For the other type, result records in an algorithm form groups, each of which comprises a set of transactions that present an issue. As was already noted, in each group specified values are either equal or similar to one another. One aspect of reviewing the results of these algorithms is to isolate the records in each group so that you can compare them to identify risks.
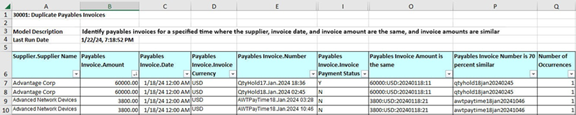
For example, suppose the Transaction Risk Summary worksheet includes a row for an algorithm titled 30001: Duplicate Payables Invoices. It indicates that algorithm violations amount to more than $200,000, and that its worksheet includes 29 result records. (For a grouping algorithm, however, there's no direct correspondence between the number of result records and the number of issues to be investigated.)
You open the result worksheet for the algorithm. You discover that each row is the record of a payables invoice, and that these records form groups in each of which the supplier name, invoice date, and invoice amount are the same, and the invoice numbers are 70 percent similar.
Look for columns with headings that include the phrases "is the same" and "is xx percent similar" (in which xx is a number). These are the attributes that the algorithm uses to gather transactions into groups. The last of these performs the final step in defining groups; in this example, it's a column titled "Payables Invoice Number is 70 Percent Similar." You can filter on each distinct value in this column; in each case, the worksheet displays transactions that belong to one of the groups. An alternative might be to sort the worksheet on the Supplier.Supplier Name column so that you can easily compare the records for each supplier.
You may then cross-reference records in the group with payables records to determine whether any of the invoice records truly are duplicate, and if so, which. Finally, a Payables Invoice.Invoice Payment Status Indicator column indicates whether payment has been made for each record. You can cancel duplicate for which payments haven't been made. You would repeat this process for each distinct value in the column on which you're filtering.