Transaction Examples: General Risk
Algorithms may review transactions for risks other than separation of duties. Broadly, these algorithms come in two types.
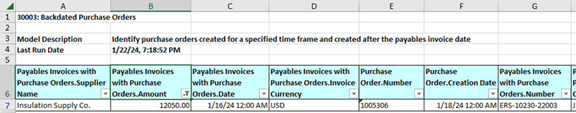
For one type, each row in the result worksheet for an algorithm is by itself a complete risk incident. For example, suppose the Transaction Risk Summary worksheet contains a row for an algorithm titled 30003: Backdated Purchase Orders. It indicates that algorithm violations amount to more than $80,000 and that its worksheet includes 35 result rows. For this algorithm type, there are therefore 35 individual issues for you to investigate.
You open the result worksheet for the algorithm. Its description tells you that each row documents a purchase order created for a time period that comes after its payables invoice date. Each record provides a supplier name, purchase order number, creator of the purchase order, and other information you can use to investigate the issue. Your first step may be to sort on its Payables Invoices with Purchase Orders.Amount column; this enables you to focus on high-value issues first.
For the other type, result records in an algorithm form groups, each of which comprises a set of transactions that present an issue. As was already noted, in each group specified values are either equal or similar to one another. One aspect of reviewing the results of these algorithms is to isolate the records in each group so that you can compare them to identify risks.
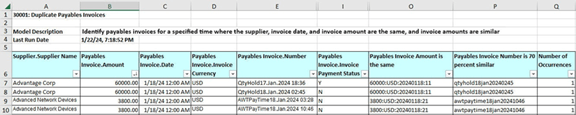
For example, suppose the Transaction Risk Summary worksheet includes a row for an algorithm titled 30001: Duplicate Payables Invoices. It indicates that algorithm violations amount to more than $200,000, and that its worksheet includes 29 result records. (For a grouping algorithm, however, there's no direct correspondence between the number of result records and the number of issues to be investigated.)
You open the result worksheet for the algorithm. You discover that each row is the record of a payables invoice, and that these records form groups in each of which the supplier name, invoice date, and invoice amount are the same, and the invoice numbers are 70 percent similar.
Look for columns with headings that include the phrases "is the same" and "is xx percent similar" (in which xx is a number). These are the attributes that the algorithm uses to gather transactions into groups. The last of these performs the final step in defining groups; in this example, it's a column titled "Payables Invoice Number is 70 Percent Similar." You can filter on each distinct value in this column; in each case, the worksheet displays transactions that belong to one of the groups. An alternative might be to sort the worksheet on the Supplier.Supplier Name column so that you can easily compare the records for each supplier.
You may then cross-reference records in the group with payables records to determine whether any of the invoice records truly are duplicate, and if so, which. Finally, a Payables Invoice.Invoice Payment Status Indicator column indicates whether payment has been made for each record. You can cancel duplicates for which payments haven't been made. You would repeat this process for each distinct value in the column on which you're filtering.