Adoption Reporting Dashboards
User adoption analytics can be added to dashboards to create different views of user activity and usage. The analytics shown here are a simple implementation of the User Adoption subject areas.
There are prebuilt reports that you can use as a starting point for user adoption. Use these as a template and modify them to suite your business needs. Download the User Adoption catalog from the User Adoption – Object Activity and Resource System Usage page on Customer Connect.
-
User login - Uses subject area Sales - CRM Resource System Usage.
-
Active and inactive user reporting - Uses subject area Sales - CRM Resource System Usage.
-
Team level metrics - Uses subject area Sales - CRM Object Activity
-
Object activity reporting - Uses subject area Sales - CRM Object Activity
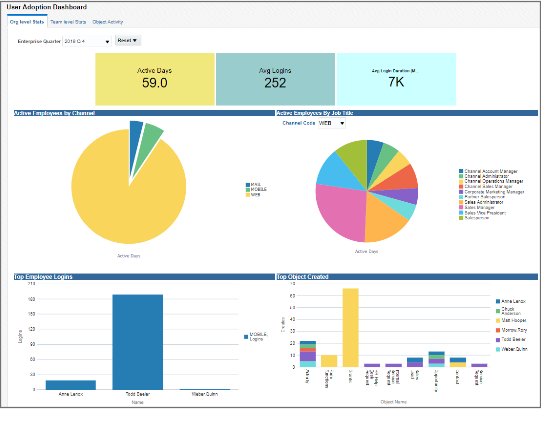
User Login Dashboard
This dashboard shows analytics related to user activity. Detail is shown for:
-
User login activity across different channels.
-
User activity by job role.
-
Most active users and the most used objects.
Active and Inactive Users Dashboard
This dashboard shows how users are coming and going in the application as well as where they are coming from to get there. Detail is shown for:
-
User activity count over periods of Year, Quarter, Month , or Week.
-
User activity across channels for periods of year, quarter, month , or week.

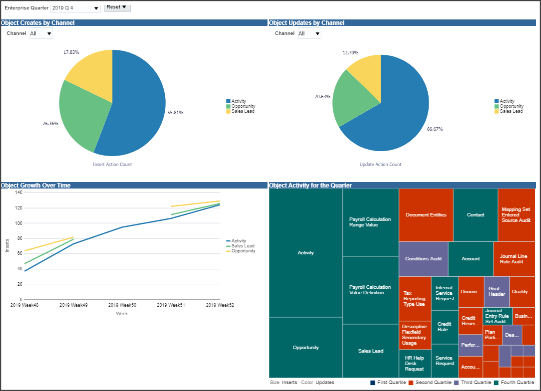
Object Activity Dashboard
This dashboard shows what areas of the application your team is using. For example, when a record is created or updated and saved, such as an opportunity, the activity is reported. Detail is shown for:
-
Activity by employees.
-
Heavily used work areas.
-
Work area usage based on channels and job roles.
-
Negative reporting: Identify Employees / Teams that are least or not active.
-
Negative reporting: Identify channel adoption rate across teams / employees.
-
Team reporting: Identify areas / objects that the team uses more.
-
Team reporting: Understand the Team's usage to help in identifying knowledge gaps.
-
Team reporting: Get insights with emerging patterns in usage based on team's job role / channel of login, and objects used.
Deploy and Implement the Object Activity Dashboard
To get your object activity dashboard set up, you need to un-archive the "UserAdoption.catalog" files that hold all the individual reports, dashboard prompts, and the dashboard. Ensure that you un-archive the catalog under the /shared/custom/ folder to retain the references from, the dashboard to the individual files. You may have to update or correct the references.
Implementation notes:
-
The data fetched is for the selected Enterprise Quarter from the report prompt.
-
The Subject areas is available from 19B onward.
-
Schedule the ESS job Refresh BI Reports Audit Data for User Adoption Reporting to collect the audit data.
The ESS job accepts 2 parameters:
-
Full Load (Y/ N): Set to N to incrementally capture the audit data. This setting ensures better performance and prevents the deletion of all of the historical audit data you collect. A setting of Y deletes all of your historical audit data regardless of the number of months you enter in the Purge after (Months) parameter.
-
Purge after (Months): Enter the number of months you want to retain the audit data. Entering 12, for example, causes the purging of audit data you collected that's older than 12 months. You always retain the latest 12 months worth of data. If you're starting to capture data today, the audit will start purging a month's worth of data after at the end of the 13 month.
-