Create an Opportunity Analysis
You can keep an eye on your revenue pipeline using Opportunity analytics. Opportunities can be looked at over different time periods, or the current time period. You can examine each stage of an opportunity and the associated revenue for that stage.
How to Create an Opportunity Analysis
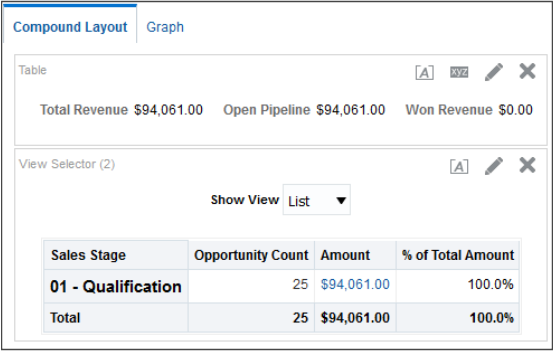
The simple analysis you build in this example shows Total Revenue, Open Pipeline, and Won Revenue for sales representatives for the current quarter. Keep in mind you can add any columns you want from the CRM Pipeline subject area. You can even add columns from other subject areas. But for this exercise, let's keep it simple.
To Create an Opportunity analysis:
-
Navigate to BI.
-
Select the New drop-down list.
-
Select Analysis.
-
Go to the editing palette and on the Subject Area panel expand the Sales - CRM Pipeline subject area.
This subject area Sales - CRM Pipeline includes the following columns and facts to use for this example.
Columns and Facts
Definition
Sales Stage
Contains data on the stage the opportunity on in the pipeline.
Amount
Contains the amount of the opportunity revenue at a stage in the pipeline.
Open Pipeline
Contains the amount of the revenue not closed in the pipeline.
Won Revenue
Contains the amount of revenue closed in this quarter.
Total Revenue
Contains the amount of all opportunity revenue in the pipeline for this quarter.
Enterprise Quarter
Contains real time opportunity custom data
Pipeline Facts: Number of Opportunities
Contains real time revenue data
-
In the Subject Areas Panel, in the Sales - CRM Opportunities subject area, expand Historical Sales Stage. Add the columns: Sales Stage, Sales Stage Name, and Sales Stage Row ID.
-
Expand Pipeline Detail Facts: Add Amount, Open Pipeline, , Won Revenue, % of Total Amount.
-
Expand Pipeline Facts:# of Opportunities.
-
Expand Employee. Add Employee Row ID.
-
Expand Time. Add Enterprise Quarter.
-
Expand Employee. Add Employee Login. On the editing palette, on Employee Login, hover over the gear image and from the drop-down list menu and select Filter. Under Add More Options select Session Variable. In the Session Variable add:
USER_PARTY_ID. Select OK. From the drop-down list again, select Delete. You only added the column to add the variable. Adding this variable tells the application to show data for the signed in user specific to her opportunities only. -
That's it. Now let's see what it looks like. Select the Results tab and there it is. Don't forget to name and save your analytics.