Queries and Performance
When an analysis runs, database aggregation and processing is prioritized so that there's as little data as possible sent to the BI Server for more processing. When creating analyses, you should reinforce this principle to maximize performance.
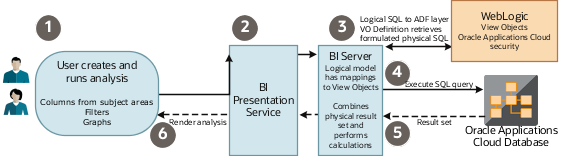
Here's what happens when a query runs, in three phases:
-
SQL compiles
-
Database SQL runs
-
Data set is retrieved and displayed in an analysis
|
Phase |
Step |
Description |
|---|---|---|
|
1 |
1 |
You create an analysis with columns from one or more subject areas, add appropriate filters and graphs, and then run it. |
|
1 |
2 |
The BI Presentation Service receives the request and sends a logical SQL statement based on subject areas and columns to the BI Server. |
|
1 |
3 |
The BI Server does these things:
|
|
2 |
4 |
The database query, including the aggregations and data security, runs in the database. |
|
2 |
5 |
The aggregated data set is returned to the BI Server, which merges the results and applies any additional calculations or filters. |
|
3 |
6 |
The final data set is returned to the BI Presentation Service, where it's formatted for display and shown in the analysis. |
How You Maximize Performance
The way you design an analysis affects how the BI Server builds the physical query, which determines how much processing is focused in the database to maximize performance. You should also consider some other factors while creating ad-hoc analyses.
Here are some key things you can do to improve how your analyses perform:
-
Select only required subject areas and columns. What you select determines which view objects and database tables are used in the database query. Any unnecessary table means more queries and joins to process.
-
Add proper filters to use database indexes and reduce the result data returned to the BI Server.
-
Remove unnecessary visual graphs.
-
Remove unused data columns. Any columns not used in visual graphs are included in the physical SQL execution, which may increase database query processing overhead.
Here are some of the factors that can hurt query performance, and what you can do to improve it.
|
Factor |
Description |
Suggestions |
|---|---|---|
|
Security |
Analyses may perform well for a user with broad security grants, but worse for those with more restrictions. |
Review and simplify your security. Minimize the number of roles and don't use complex custom queries to enforce data security. |
|
Cross-subject areas |
Analyses including two or more subject areas can impact performance. |
Review your analyses to see if you can remove some of the subject areas in the queries. Are all of the subject areas required? When you built the analysis, did you notice a performance impact while adding a particular subject area? |
|
Hierarchies |
Hierarchies, particularly large ones, can impact performance. Queries on trees and hierarchical dimensions such as manager can have an impact on performance. The BI Server uses a column-flattening approach to quickly fetch data for a specific node in the hierarchy. But there's no pre-aggregation for the different levels of the hierarchy. |
Remove hierarchies to see if performance improves. It's also important to carefully craft any query to apply enough filters to keep the result set small. |
|
Number of attributes |
Analyses often use a large number of columns that aren't required. |
Reduce the number of columns in the criteria as much as possible. |
|
Flexfields |
Using too many flexfields in analyses can hurt performance in some cases. |
Remove flexfields to see if the performance improves. Avoid flexfields in filters. |
|
Data volumes |
Analyses that query large volumes of data take longer. Some may query all records, but only return a few rows, requiring a lot of processing in the database or BI Server. |
Consider adding filters in your analysis, especially on columns with indexes in the database. Avoid blind queries because they're run without filters and fetch large data sets. All queries on large transactional tables must be time bound. For example, include a time dimension filter and additional filters to restrict by key dimensions, such as worker. Apply filters to columns that have database indexes in the transactional tables. This ensures that a good execution plan is generated for the query from the BI Server. |
|
Subquery (NOT IN, IN) |
Filtering on IN (or NOT IN) based on the results of another query means that the subquery is executed for every row in the main query. |
Replace NOT IN or IN queries with union set operators or logical SQL. |
|
Calculated measures |
Calculating measures can involve querying a lot of data. |
Use the predefined measures in your subject areas wherever possible. |
|
Filters |
Analyses with no filters or filters that allow a large volume of data may hurt performance. |
Add filters and avoid applying functions or flexfields on filter columns. If possible, use indexed columns for filters. Refer to OTBI subject area lineage for your offering, which documents indexed columns for each subject area. |
Review further guidelines about analysis and reporting considerations in My Oracle Support(Doc ID 2679006.1).