Subject Area Context And Analytic Results
If your analytic doesn't look right, or columns of information aren't showing up, it could be an issue with context. The context defines what column details the analysis displays. Adding an employee column doesn't mean all employees show up in the analysis.
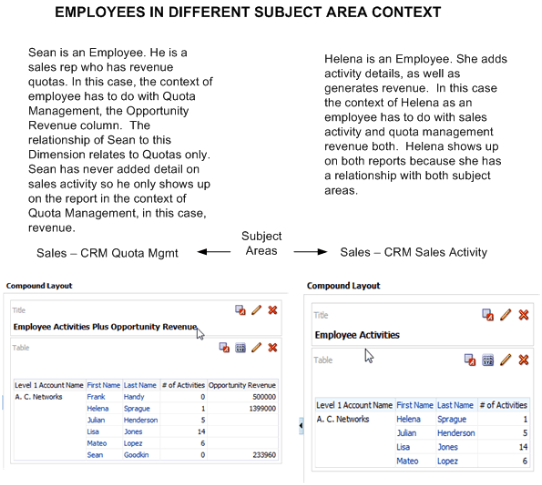
The subject area dimension folders contain the columns and the facts folders define the relationship of the columns. If you add the Employee column to your analysis, and then add the Fact, Number of Activities to the same analysis, then only the employees that have one or more activities show on this analysis in this context. There might be hundreds of employees that have some sort of relationship with A.C. Networks, but no associated activities, so they don't show up on your activity analysis.
The following is an example that might help explain this further.
In this exercise you will build an activity analysis, and add an additional subject area, then explore some different scenarios.
-
Build an activity analysis as directed in "Create an Activity Analysis".
-
With your activity analysis in edit mode, add the standard subject area Sales - CRM Quota Management.
-
Both subject areas appear under Subject Areas. Expand Sales - CRM Sales Activity. Expand Customer. Expand Sales Account Extension. Drag Level 1 Account Name onto the palette.
-
Still in Sales Activity, expand Employee. Drag First Name and Last Name onto the palette.
-
Expand Facts, then Activity Facts. Drag # of Activities onto the palette. This fact is key to this analysis because the relationship of Employee to this subject area is dependent on the employee having one or more activities for one or more accounts. If your employee has never entered activities for any given account, they don't t show up on this report, even if they have another type of relationship with an account. Since the context of this subject area has to do with sales activities, only employees with activities are included.
-
Now select the "Results" tab. You see four employees in the resulting analysis. Each of these employees has one or more activities.
-
Now select the "Criteria" tab. Under Subject Areas expand Sales - CRM Quota Management. Expand Facts. Expand Pipeline Facts and drag Opportunity Revenue to the palette.
-
Go to the "Results" tab. Notice that now there are more employees. This result is because you have added employees that also have relationships to Quota Management. In this case, employees are added that have generated revenue.
-
Go back to "Criteria". Remove # of Activities. The results show only the three employees that have revenue. Helena has both revenue and activities so she shows up in both scenarios.
Finally, note that if you remove both # of Activities and Opportunity Revenue and look at the results, you again have only the four employees that have a relationship with only the Sales Activity dimension.