Create a Chart or a KPI from a Prompt
You can have an AI agent create charts, tables, and KPIs for you by entering prompts in the sales dashboard Ask Oracle bar.
Users with sales administrator privileges can save the generated content in the content library and add it to their personal sales dashboard. The saved content is also saved as a visualization that you can edit using the Visualization Configuration tool and add to sales dashboards. For example, you can create a KPI with the prompt and then add a badge in the Visualization Configuration tool.
- Enter a prompt in the sales dashboard Ask Oracle bar:
-
To create a chart, enter a prompt and prefaced with the verb "show".
For example, enter: show lost opportunities by sales stage for the Standard Sales Process sales method . In your prompts, be as specific as possible for better results.
-
To create a KPI, enter a prompt starting with "sum of" or "number of". For example, enter: number of opportunities closed this quarter.
The prompt you enter becomes the title of the KPI.
-
When you see the Visualize selection in the list, click it or press the Shift and Return keys on your keyboard.
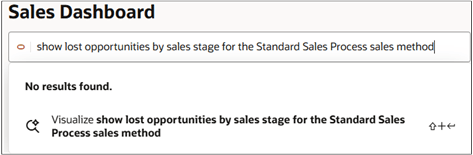
-
Depending on your prompt, the agent:
Generates a chart
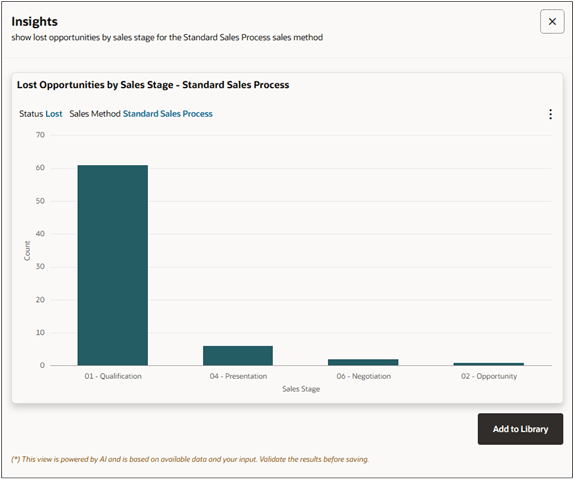
You can update the dimensions or metrics of the visualization by clicking the Action (3 vertical dots) icon. Depending on the graph type, you can change:
- The attribute on the x-axis
- The attribute that's used to categorize the data
- Graph orientation
- Graph stacking
A KPI
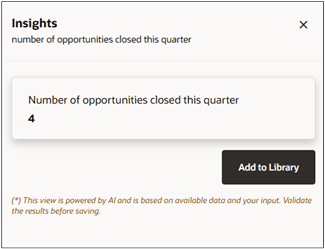
You can't edit the generated KPIs in the sales dashboard. If you want to edit the title, you must do so in the Visualization Configuration tool.
- A table.
- If you aren't satisfied with the result, rephrase your prompt and try again.
-
If you have sales administrator privileges, then you can save the generated content to the library by clicking Add to Library.
The created content appears in the list of library items that you can add when you edit the sales dashboard layout using the Edit Page Layout button.
To add the content to sales dashboards you are creating for the organization, then you must edit it in the Visualization Configuration tool and add it using Oracle Visual Builder Studio.