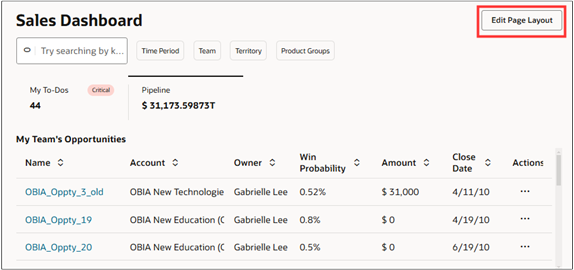
Personalize Your Sales Dashboard
You can add tabs to your personal sales dashboard with your own content. You can include content provided by administrators as well as visualizations that you created using the Express Reports tool.
Your personalization is available only to you. You can't share it.
Click the Edit Page Layout button to open the editing mode.
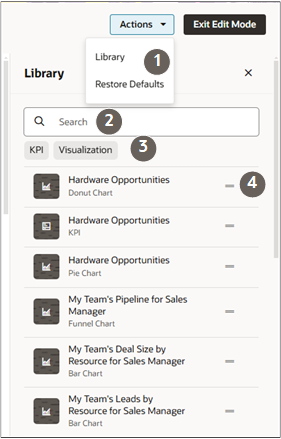
Use the Library pane to add content. To move and remove items, hover over them and use the controls.
| Callout | Feature Description |
|---|---|
| 1 | Use the Actions menu to restore the original dashboard. |
| 2 | Search for content. |
| 3 | The KPI filter displays the content available to create the top of a tab. The Visualizations filter lists the content you can add to the tab itself. |
| 4 | Drag items into place using the handles. |
Add Tabs for Your Content
You must add a tab before you can add the tab content.
-
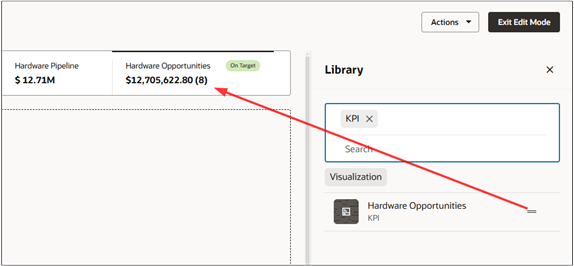
In the Library pane, click KPI to view the available KPIs that you can use for the top of your tab.
- If you have sales administrator privileges and don't see a KPI that suits your needs, then you can create one of your own. For details, see the topic.Create a Chart or a KPI from a Prompt
- Drag one of the KPI next to one of the existing tabs on the sales
dashboard.
- You're now ready to add content.
Add Content to Your Tab
You can add content only to tabs that you added yourself. You can have maximum of 5 items in a tab. You can add:
- Charts and tables created by administrators in the Visualization Configuration tool.
- Express Reports that you've created and those shared with you by an administrator.
- Charts that you created by entering prompts in the Ask Oracle bar and saved in the library (available to sales administrators only).
Here's how to add content:
- In the Library tab, click the Visualizations button.
- Search for what you want to add in the library.
- Use the handles to drag the item into place on the dashboard.
- If you have sales administrator privileges and don't see a chart that suits your needs, then you can create one of your own. For details, see the topic Create a Chart or a KPI from a Prompt.
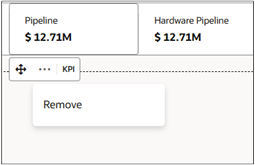
Move and Remove Content
You can only edit content that you've added.
-
To move an item, hover over it and drag using the handle.
To remove an item, hover over it and click
Restoring the Default Dashboard
You can restore the original dashboard, by clicking (the button at the top of the page).