What's a Sales Dashboard?
A sales dashboard is a centralized workspace that provides key sales metrics and insights in a single view. It aggregates data from sources such as opportunities, leads, accounts, tasks, and appointments, displaying this information through interactive visualizations, tables, and Key Performance Indicators (KPIs). Salespeople can use global search and filters to quickly find records or focus on specific aspects of sales data (including pipeline, forecasts, or account activity), without switching between multiple systems
In addition to reporting, the sales dashboard supports decision-making and workflow management. Features such as drill-down views, account summaries, and content containers allow users to move from high-level metrics to individual records efficiently. Salespeople can update records, follow up on opportunities, and assign tasks directly within the dashboard.
The dashboard also supports integration with external analytics tools, such as Tableau, PowerBI, Oracle Analytics, enabling access to advanced analytics and predictive insights within the same workspace.
Sales administrators, using the steps in this guide, can create any number of sales dashboards, each suited to a different role or individual. Personalization options let each salesperson create their own version of the dashboard with layouts, charts, and filters that best fit their needs, balancing consistency and flexibility.
For salespeople, the sales dashboard streamlines access to information and daily tasks, reducing time spent searching for data or generating reports. Managers can monitor team performance and identify risk areas at a glance, while team members have clear visibility into their pipeline and activity. By combining metrics, workflow management, and analytics, the sales dashboard serves as both a reporting tool and a central hub for sales execution.
| Feature | Description |
|---|---|
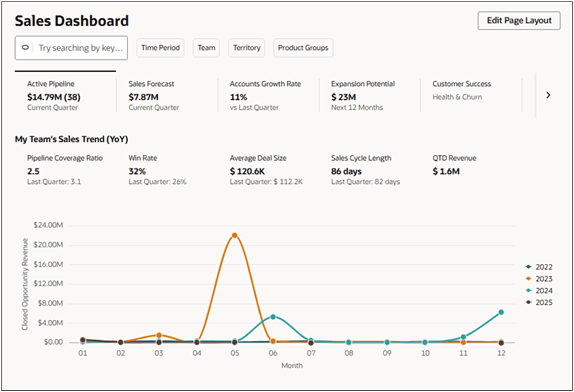
| 1 | Ask Oracle bar that you can use to search for sales information and to filter the contents of the sales dashboard active tab. |
| 2 | Filters to filter the information displayed in the active tab. |
| 3 | The Edit Page Layout button that you can use to personalize your sales dashboard. |
| 4 | The top of each tab can include Key Performance Indicators (KPIs). |
| 5 | Tab body with interactive visualizations and tables. |