Create Reports for Supply Requests and Supply Orders
Use subject areas that contain data for Supply Orchestration when you run reports in Oracle Transactional Business Intelligence.
Organize, display, and analyze data according to subject area.
|
Subject Area |
Description |
|---|---|
|
Supply Chain Orchestration - Supply Request Real Time |
Includes data that Supply Chain Orchestration receives as part of a create, update, or cancel request from an upstream source, such as purchasing or inventory. |
|
Supply Chain Orchestration - Supply Order Real Time |
Includes data that Supply Chain Orchestration receives from Order Management and Inventory Management. Includes the latest available details for work orders, purchase orders, and transfer orders. |
Here are some of the benefits you can realize.
-
Use reports and analytics to manage hundreds of sales orders and their corresponding supply orders.
-
Identify critical sales orders that have issues with supply requests and supply orders.
-
Efficiently manage supply orders that need your attention so they can reach completion.
Get details in each subject area of your report.
-
Number of successful records for each request source.
-
Number of error records for each request source.
-
Number of errors for open sales orders. Include the requested delivery date for each order according to day, such as end of month, end of quarter, and so on.
-
Number of errors for shipped or closed sales orders.
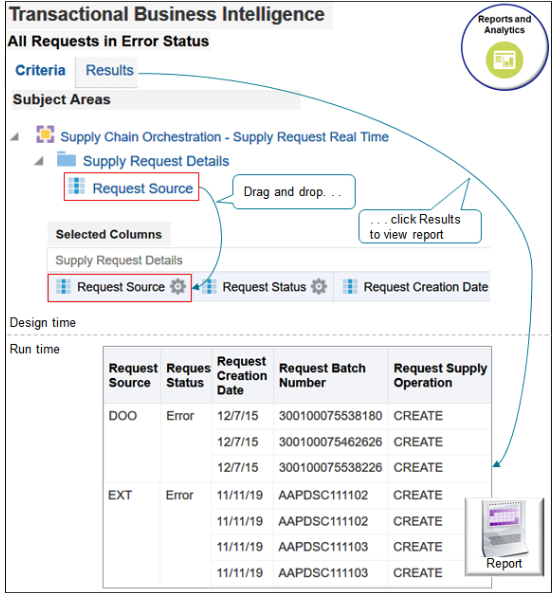
Assume you need a report that displays supply requests that are in an error status. You want the source, status, date, batch number, and operation.
Try it.
-
Go to the Reports and Analytics work area.
-
On the Reports and Analytics page, click Browse Catalogs.
Oracle Transactional Business Intelligence opens in a new tab on your browser.
-
On the Catalog page, click New > Analysis.
-
In the Select Subject Area dialog, scroll down to locate the subject areas.
-
Supply Chain Orchestration - Supply Order Real Time
-
Supply Chain Orchestration - Supply Request Real Time
-
-
Click Supply Chain Orchestration - Supply Request Real Time.
-
Add columns to your report.
-
On the Untitled page, in the Subject Areas area, expand Supply Chain Orchestration - Supply Request Real Time, expand Supply Request Details, then drag Request Source from the Subject Areas area and drop it onto the Selected Columns area.
-
Repeat for other subject areas. Drag and drop so the Selected Columns area resembles this sequence.
Request Source
Request Status
Request Creation Date
Request Batch Number
Request Supply Operation
-
-
-
-
-
-
Click Save Analysis.
-
-
Modify a column. Assume you want the month, day, and year but not the time of day.
-
Click the gear next to Request Creation Date, then click Column Properties.
-
In the Column Properties dialog, click Date Format, then add a check mark to Override Default Date Format.
-
Delete all the content in the Custom Date Format window except for M/d/yy, click OK, then click Save Analysis.
-
-
Add a filter.
-
In the Save As dialog, name your report All Requests in Error Status, then click OK.
-
In the Selected Columns area, click the gear next to Request Status, then click Filter.
-
In the Filter dialog, set the value to
Request Status is equal to Error. -
Make sure the Filter by Request Status Code contains a check mark, click OK, then click Save Analysis.
-
-
Click Results, wait for the result to finish building, then examine the results.
Report on a Wide Range of Data
Here are just a few examples of the kind of data you can report on.
-
Count of supply requests from DOO in status Error sorted by year.
-
Count of supply requests from DOO in status Success sorted by year.
-
Errors for columns across subject areas.
-
Supply lines that are in error for open sales orders.
-
Closed supply orders for configured items sorted by year.
-
All supply requests that are in status Success sorted by day.
-
Closed and fulfilled supply orders with sales orders that are in Processing status.
-
Transfer orders that are in error sorted by item.
Get a Full Picture of the Supply Chain
Here's an example of a run time report that follows a sales order from start to finish.
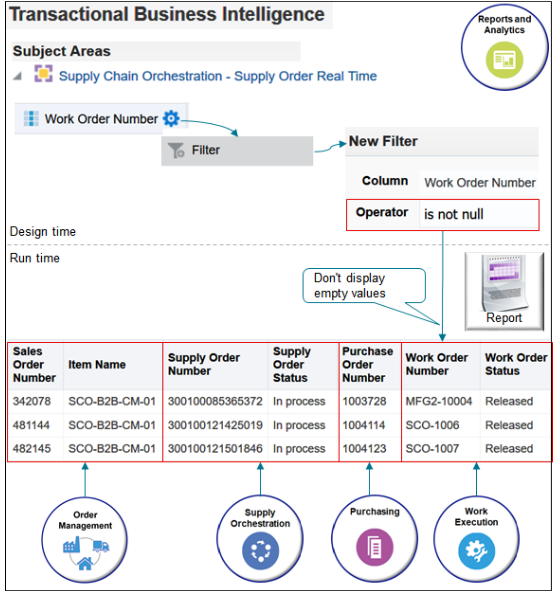
This example also illustrates how you can filter data to avoid a lot of unwanted empty output. Assume you want a full picture of the supply chain but are only interested in flows that include the sales order, supply order, purchase order, and work order. You don't want to display a lot of rows that don't have any purchase orders, work orders, and so on. You can filter the data.
Try it.
-
Expand the Supply Chain Orchestration - Supply Order Real Time subject area.
-
Filter work orders.
-
Add the Work Order Number subject area to the Selected Columns area.
-
Click the gear next to Work Order Number in the Selected Columns area, then click Filter.
-
In the New Filter dialog, set the values.
Attribute
Value
Column
Work Order Number
Operator
Is Not Null
-
-
Create similar filters for Supply Order Number and Purchase Order Number.
Here's what this example does.
-
Get sales order data, such as the sales order number and item, from Order Management.
-
Get supply order data, such as the supply order number and status, from Supply Chain Orchestration.
-
Get purchase order data, such as the purchase order number, from Purchasing.
-
Get work order data, such as the work order number and status, from Inventory Management.
Organize According to Date
Need to scan the status of supply orders according to source, organized by date, and drill down on date? Use the time subject areas.
-
Time - Supply Request Creation Date
-
Time - Supply Request Need by Date
Arrange your report according to time, such as by day, week, month, or year, including start dates and end dates.
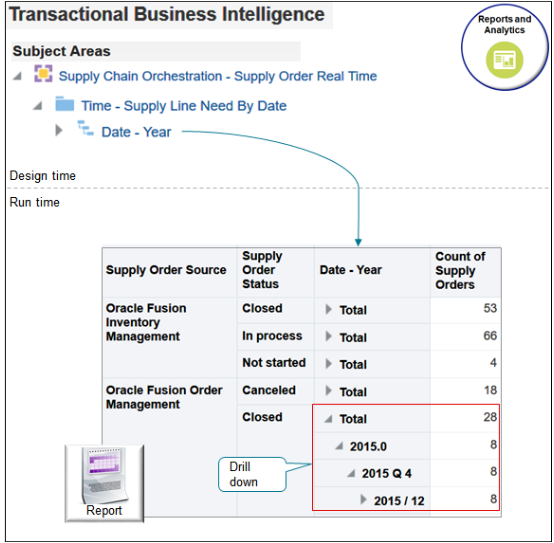
Here's an example that organizes supply orders according to date.
Try it.
-
Expand Supply Chain Orchestration - Supply Order Real Time, expand Supply Order, then drag and drop Count of Supply Orders.
-
Under Supply Chain Orchestration - Supply Order Real Time, expand Supply Header Details, then drag and drop Supply Order Source and Supply Order Status.
-
Under Supply Chain Orchestration - Supply Order Real Time, expand Time - Supply Request Need by Date, then drag and drop Date - Year.
-
Click Save and name your report Count of Supply Orders According to Date.
-
At run time, expand the Date - Year column down to the level you need, from the year all the way down to the day.
Points to Consider
Filter and manipulate column data to focus your report.
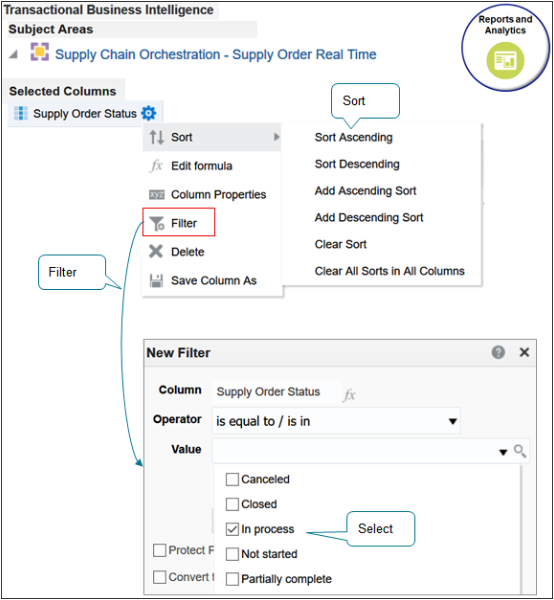
Filter your data.
-
Use the Filter action to filter data. Select from a variety of operators, then select a value. For the value, the dialog makes life simple. It filters the values you can select according to subject area. For example, if the subject area is Supply Order Status, then select one or more statuses.
-
Use the Edit Formula action to create your own formula that filters results. Include functions, columns, variables, equations, and so on in your formula.
-
The result might take minutes to build, depending on you set up the report and the volume of data you're reporting. If it takes too long, add filters or remove columns.
-
Consider how each subject area you add to your report affects report output. For example, if your report includes Request Supply Operation, and Item Number, then the output might include more than one item number for each operation because the relationship between operation and item number is one to many. Other relationships between columns might result in a lot of rows in one column for only one row in another column. The good news is that you filter and sort to meet your specific requirements.
-
Use the Item Type subject area to filter according item type, such as configured item.
Sort your data.
-
Use the Sort action to sort data.
-
Use Sort Ascending or Sort Descending to sort report output according to column. For example, sort on Request Supply Operation so the report displays all records that include a Cancel operation, then Create operations, then Update.
-
Use Add Sort Ascending or Add Sort Descending to add more than one level of sort. For example, sort ascending on Request Supply Operation and use Add Sort Ascending on Request Creation Date to sort according to the operation, than according to date within each operation.
Do other cool stuff.
-
Use column properties to change appearance, such as font, alignment, borders, headings, suppress repeating values, and so on.
-
Consider adding graphics to improve the impact of your reports.
-
Add columns in real time. If you're reviewing a report and want to add data, there's no need to go back to the Criteria tab. When you're on the Result tab, just drag the data you want from the Subject Area, then drop it onto the report.
-
Right-click each column in the report output to sort, remove, exclude, and so on.
Some of the Attributes You Can Use In Your Reports
Hundreds of attributes are available. This section lists a few of them.
Display attribute values in your report.
-
Request Batch ID
-
Request Source
-
Request Source Line
-
Request Reference Number
-
Item Number
-
Requested Quantity
-
Requested Delivery Date
-
Requested Supply
-
Message Text
-
Request Status
-
Exception Date
-
Supply Operation
-
Request Submitted By
Display attribute values for sales orders.
-
Sales Order Number
-
Order Line
-
Fulfillment Line Status
-
Line Quantity
-
Line Scheduled Ship Date
Display attribute values for work orders.
-
Work Order Number
-
Work Order Status
-
Planned Completion Date
For details, see: