How a Forecast Tree Is Constructed
You determine the forecast tree by configuring a table just as you would for a table displayed in your Oracle Fusion Cloud Supply Chain Planning module.
The forecast tree is derived from the table's layout. In the table, you select levels to include in the forecast tree, and on the Layout tab in the Selector Tool, you arrange the levels in the decreasing order of data aggregation. Finally, you select the table as the forecasting table for a forecasting profile.
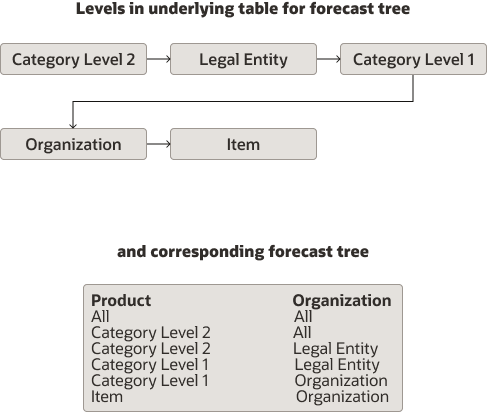
The forecasting process constructs the forecast tree downwards from a fictitious top level (All – All) to the lowest level of aggregation. Each included level is taken one at a time and placed in a forecast tree level under the column for the respective dimension.
Assume that you have arranged the levels in the decreasing order of aggregation as follows: Category Level 2, Legal Entity, Category Level 1, Organization, and Item.
For this level arrangement, the forecasting process constructs the forecast tree as follows:
- First, the fictitious top level of the tree is designated as All – All.
- At the next forecast tree level, the Category Level 2 level replaces the All level under the column for the Product dimension.
- At the next forecast tree level, the Legal Entity level replaces the All level under the column for the Organization dimension. The Category Level 2 level is retained under the column for the Product dimension.
- At the next forecast tree level, the Category Level 1 level replaces the Category Level 2 level under the column for the Product dimension. The Legal Entity level is retained under the column for the Organization dimension.
- At the next forecast tree level, the Organization level replaces the Legal Entity level under the column for the Organization dimension. The Category Level 1 level is retained under the column for the Product dimension.
- At the lowest forecast tree level, the Item level replaces the Category Level 1 level under the column for the Product dimension. The Organization level is retained under the column for the Organization dimension.
The demand forecasting process moves up this forecast tree while performing the forecast. First, the forecast is attempted at the level of Item and Organization. If a forecast can’t be performed at this level, the forecast is attempted at the next level of Category Level 1 and Organization, and so on.
The following figure depicts this forecast tree:

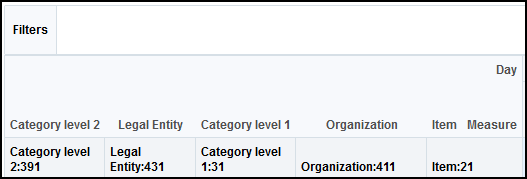
The following screenshot depicts the arrangement of levels on the Layout tab in the Selector Tool for the previously provided forecast tree:
