View Calendar Details Example: Aggregate Planning Buckets
This example describes a planned make order in a constrained plan, using aggregate planning buckets.
The Earliest Start Date and Latest Start Date are displayed in the header section. These fields are displayed only in a constrained plan. These dates are also plotted in the Gantt chart, if the dates fall within the Gantt window.
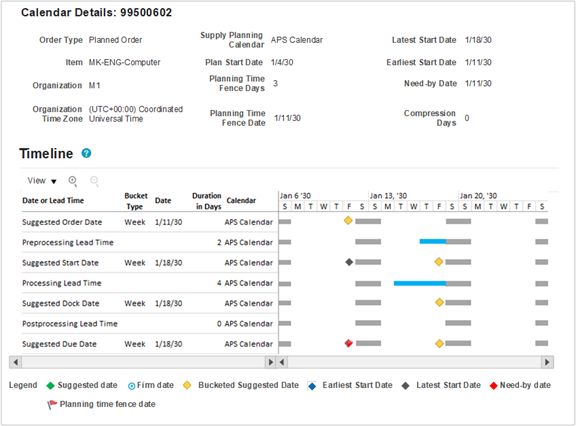
In this example, the supply planning bucket type for each suggested date is week. Depending on your plan options, it's possible for some suggested dates to have a different bucket type than others. For example, some dates might fall into a daily bucket while other dates for the same supply might fall into a weekly bucket.
When planning in aggregate time buckets, meaning a time bucket that is higher than a day, the suggested dates are moved to the last working day of the supply planning bucket during plan run. A yellow diamond on the Gantt chart indicates a suggested date that has been moved to the last working day of the supply planning bucket.
| Date or Lead Time Row | Value | Explanation |
| Suggested Due Date | January 18 |
In this example, the Suggested Due Date is later than the Need-by Date. This is a constrained plan, so there was some constraint that caused the Suggested Due Date to be after the Need-by Date. If needed, planning will move the Suggested Due Date out so that it’s on or after the Planning Time Fence Date. In this case, the Planning Time Fence Date is January 4 (the same day as Plan Start Date and Need-by Date), so it had no impact on the Suggested Due Date. Because this is a planned make order, the calendar used in calculating the Suggested Due Date, as well as all other suggested dates, is the Organization Manufacturing Calendar. In this example, the calendar used is APS Calendar, which has Saturdays and Sundays as nonworking days. Planning always ensures that the Suggested Due Date is on a working day, however, a planner may firm the order on a nonworking day. If the order is firmed, the Gantt chart will display the Suggested Due Date using the firm date icon (a blue circle), in place of the regular green diamond icon. The planning bucket type for this date and all other dates is week. This tells you that the Suggested Due Date was moved to the last working day of the planning bucket, which is what happens when planning in aggregate time buckets. |
| Postprocessing Lead Time | 0 days |
The Postprocessing Lead Time’s duration in days value comes from the Items page and includes any simulation set overrides. In this example, the Postprocessing Lead Time is zero, so there’s no need to calculate Postprocessing Lead Time start and end date. If Postprocessing Lead Time wasn’t zero, it would be calculated as follows:
|
| Suggested Dock Date | January 18 | Given that the Postprocessing Lead Time is zero, a Suggested Dock Date that is the same as the Suggested Due Date is expected. |
| Processing Lead Time | 4 days |
The Processing Lead Time’s duration in days value comes from the Items page and includes any simulation set overrides. The Processing Lead Time end date is set to the Suggested Dock Date. The start date of the Processing Lead Time is calculated by subtracting the Processing Lead Time from the end date of the Processing Lead Time, only counting the working days. In this example, the Processing Lead Time starts at the beginning of the day on Tuesday, January 15, and goes through the end of the day on Friday, January 18. The calculation of Processing Lead Time start and end dates is performed when the UI is displayed, after planning has moved the Suggested Dock Date to the last working day of the planning bucket. As a result, the processing start and end dates might not match the dates that were calculated during plan run (which is done before moving the Suggested Dock Date to the end of the planning bucket). This loss of precision is expected when displaying calendar details of a supply that was planned using aggregate time buckets. |
| Suggested Start Date | January 18 | The Suggested Start Date was moved to the last working day of the supply planning bucket, so it ended up being the same date as the Suggested Dock Date. This is because both dates (after accounting for Processing Lead Time) fell into the same supply planning bucket. |
| Preprocessing Lead Time | 2 days |
The Preprocessing Lead Time’s duration in days value comes from the Items page and includes any simulation set overrides. The Preprocessing Lead Time end date is set to the Suggested Start Date. The start date of the Preprocessing Lead Time is calculated by subtracting the Preprocessing Lead Time from the end date of the Preprocessing Lead Time, only counting the working days. In this example, Processing Lead Time starts at the beginning of the day on Thursday, January 17, and goes through the end of the day on Friday, January 18. The calculation of Preprocessing Lead Time start and end dates is performed when the UI is displayed, after planning has moved the Suggested Start Date to the last working day of the planning bucket. As a result, the preprocessing start and end dates might not match the dates that were calculated during plan run (which is done before moving the Suggested Start Date to the end of the planning bucket). When suggested dates are moved to the last working day of the supply planning bucket, it's common to see that lead times overlap in the Calendar Details window. In this example, we see that Preprocessing and Processing Lead Times are overlapping. This loss of precision is expected when displaying calendar details of a supply that was planned using aggregate time buckets. |
| Suggested Order Date | January 11 | While not obvious at first, it makes sense that the Suggested Order Date is Friday, January 11. When calculating the Suggested Order Date, planning had to account for 4 days of Processing Lead Time and 2 days of Preprocessing Lead Time, without any overlap. This caused the Suggested Order Date to fall into the prior planning bucket (before the Suggested Order Date was then bucketed to the last working day of the planning bucket). |