Example of an Incorrectly Constructed Forecast Tree
This topic provides an example of a forecast tree that's incorrectly constructed because the underlying forecasting table was incorrectly set up.
On the Layout tab in the Selector Tool, the hierarchy levels on the row edge of the forecasting table for the forecast tree must be in the order of decreasing data aggregation. While generating the forecast tree, the demand forecasting process can move in only the direction of decreasing aggregation. If a level of higher aggregation follows a level of lower aggregation, the process ignores the former. Thus, an incorrect arrangement of levels results in a forecast tree that doesn’t meet expectations and causes an incorrect aggregation of data during the forecasting process.
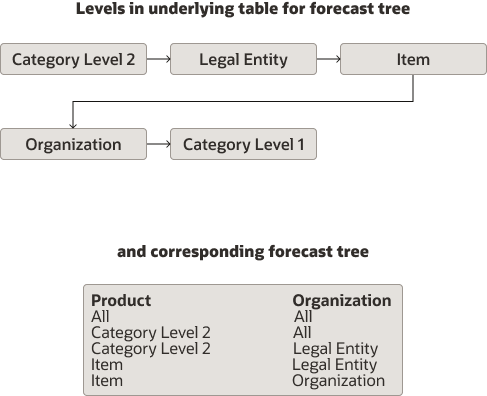
Assume that you have arranged the levels as follows: Category Level 2, Legal Entity, Item, Organization, and Category Level 1. Here, a level with a higher aggregation (Category Level 1) is placed after a level with a lower aggregation (Item).
For this level arrangement, the forecasting process constructs the forecast tree as follows:
- First, the fictitious top level of the forecast tree is designated as All – All.
- At the next forecast tree level, the Category Level 2 level replaces the All level under the column for the Product dimension.
- At the next forecast tree level, the Legal Entity level replaces the All level under the column for the Organization dimension. The Category Level 2 level is retained under the column for the Product dimension.
- At the next forecast tree level, the Item level replaces the Category Level 2 level under the column for the Product dimension. The Legal Entity level is retained under the column for the Organization dimension.
- At the next forecast tree level, the Organization level replaces the Legal Entity level under the column for the Organization dimension. The Item level is retained under the column for the Product dimension.
- Finally, the Category 1 level is omitted from the forecast tree on account of having a higher aggregation than the Item level.
The following figure depicts the forecast tree: