About the Geomap Chart Type
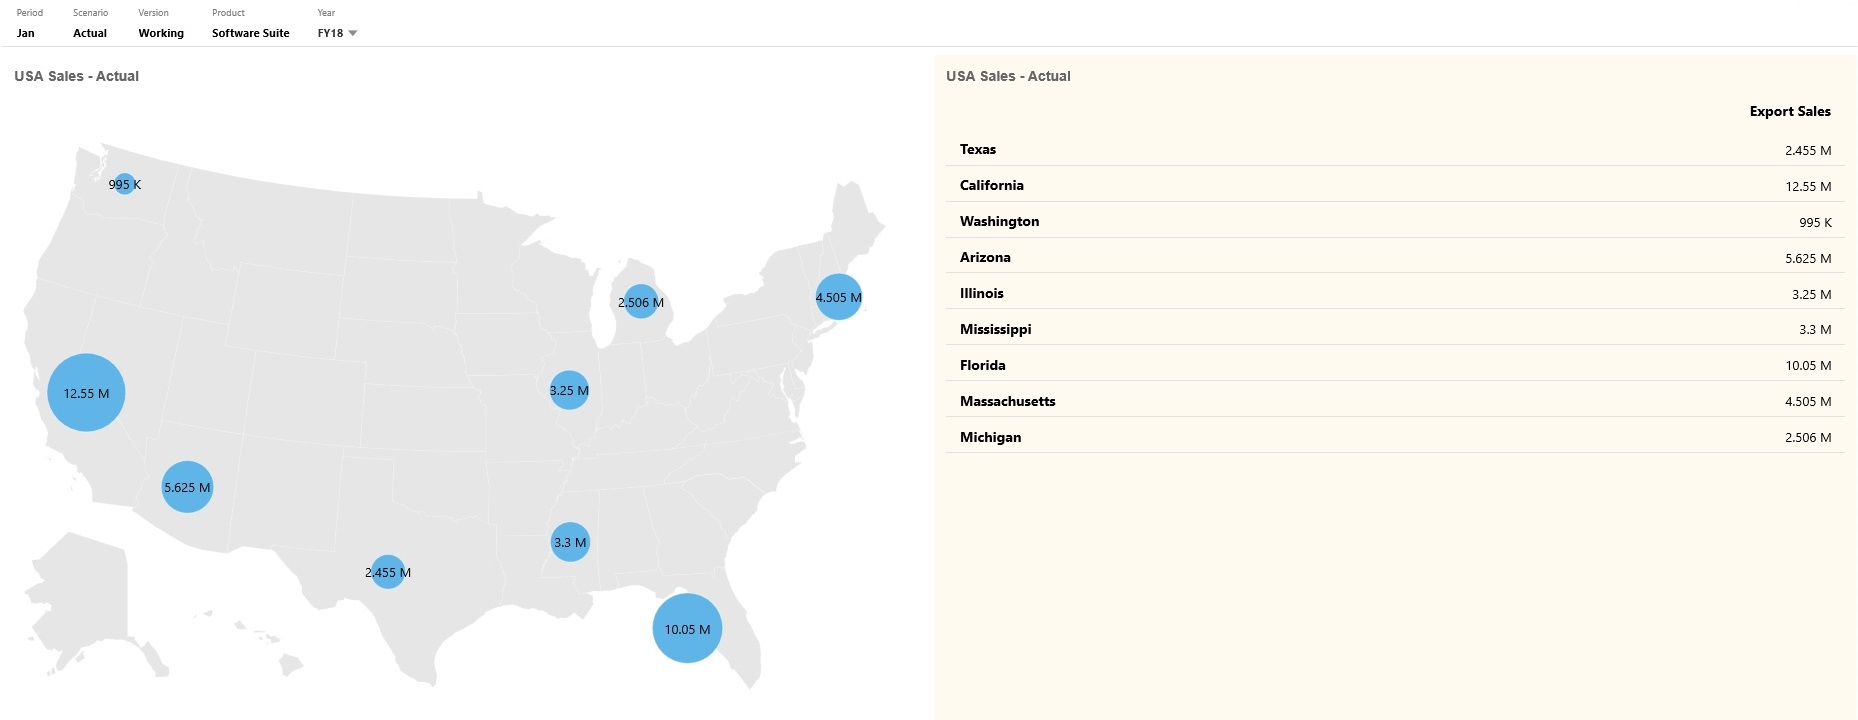
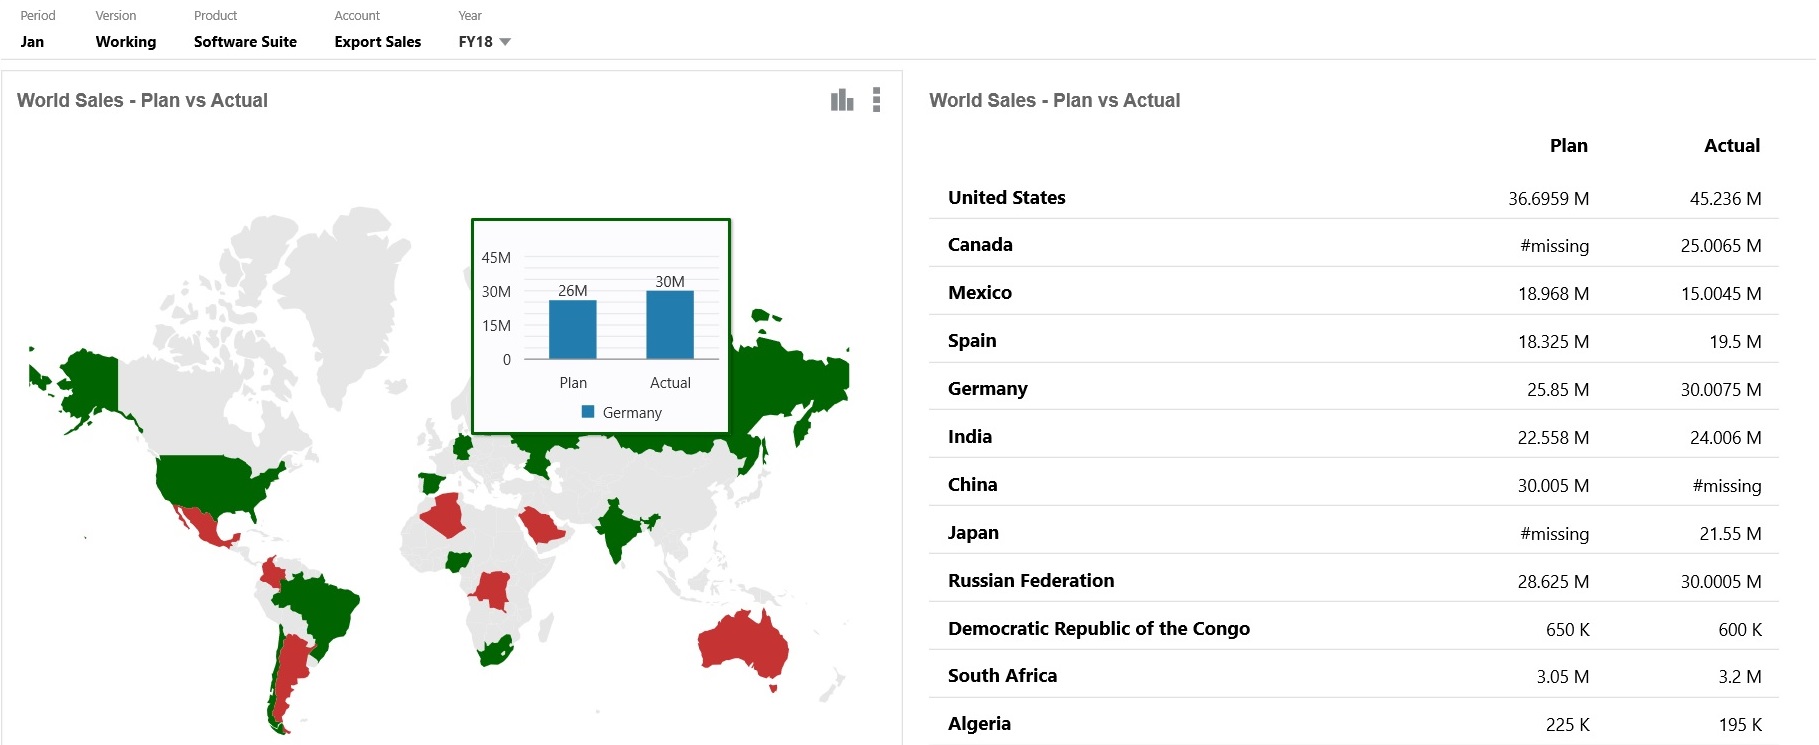
Geomaps are geographical maps with overlays and charts that display some measure about each of the geographical areas that are displayed. Hovering over the bubbles or the color highlight in the Geomap displays a data label.
Note:
Color highlight geomaps are designed to show any variances (red or green, depending upon your Desired Variance Trend setting) based on the values in the underlying data. If a geomap region has missing values in the 1st or 2nd column or if the values in those columns are equal and there is no variance, the region will be highlighted blue. Hovering over a highlighted region displays a bar chart with all the values for the row except for any missing values.
Example Geomap - USA Sales Using Data Bubbles

Example Geomap - World Sales Using Color Highlight

Dashboard designers can set these geomap chart properties:
Table 10-6 Geomap Chart Properties
| Setting | Description |
|---|---|
|
Map Layer |
Select World or narrow the scope of the map to a continent such as Asia, North America, or Africa. |
|
Type |
The Data Bubbles geomap displays data as sized bubbles over the map layer. The Color Highlight geomap compares two data values, displaying geographical areas that have an increase in green, and those with a decrease in red. Select Data Bubbles or Color Highlight and then specify the following additional options:
|
|
Geography Names |
We've provided you with a metadata load file that contains the geographical elements the geomap uses like countries, states, and cities. Click to download a CSV file which you can then upload into a dimension as new members or (with some manual changes) as aliases to existing members in your application. Note that geomaps only work if the geography names in the forms match exactly the geography names that Dashboard 2.0 uses for its map layers. So if your entity/geography dimension says, for example, USA, that won't be recognized as a valid name in the map layer, which uses United States. |
Videos
| Your Goal | Watch This Video |
|---|---|
|
Learn how to download geography members for geomap charts, then import them into your dimension. You learn how to set up both data bubble and color highlight geomap charts. |