Understanding Dashboards
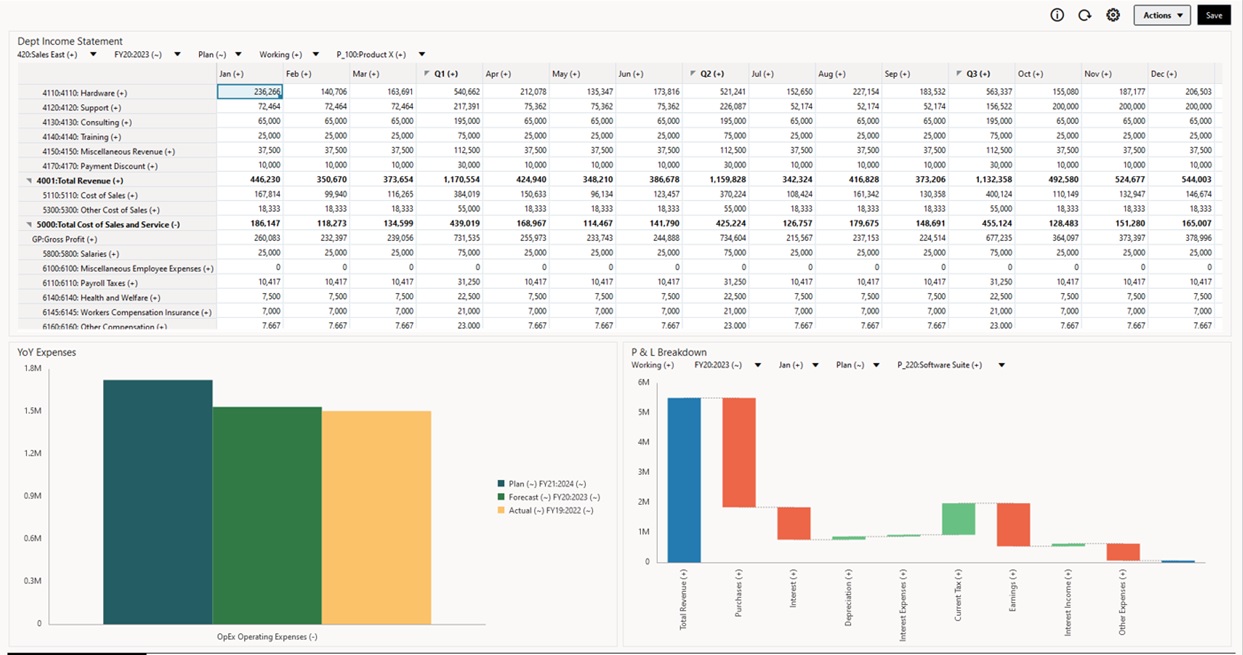
Dashboards give you an overview to key information and let you enter, change, and save data.
You can work with multiple forms or charts, enter data or change the data in one, and see the immediate effects in other forms, charts, and tiles in the dashboard. Change a driver in the grid and see its impact immediately in the chart.
When you save data, it's saved in all the objects in a dashboard. Depending on the form's design, you can also drill down into more detail. You can select which members to work with and change chart types, for example. Hovering your mouse over chart elements highlights the element and displays a data label. Your administrator creates dashboards, but you have a lot of flexibility when using them. For example, for many chart types, you can customize the colors that represent the data.
Note:
You can no longer mark a dashboard page as default.
Dashboard 1.0 Example

Dashboard 2.0 Example
