User Productivity Report
This report shows the total time spent by users on System (WMS), VAS and Manual activities during the requested time period. This report can consolidate and pull data for a maximum of 6 months. “Total Time” indicates the total time the user spent on WMS, VAS and System activities during the requested time period. “Total Lead Time” indicates the time the user appears to have been in the warehouse but was neither working on any activity nor was in a break.
Total Lead Time Calculation
Total Lead Time is calculated as shown below
Total Facility Time - (Total Time + Total Break Time)
where
Total Facility Time = CO-Facility minus CI-Facility
Total Break Time = CO-Break minus CI-Break
Total Time = Total WMS Time + Total VAS time + Total Manual Time
Example with Sample Data
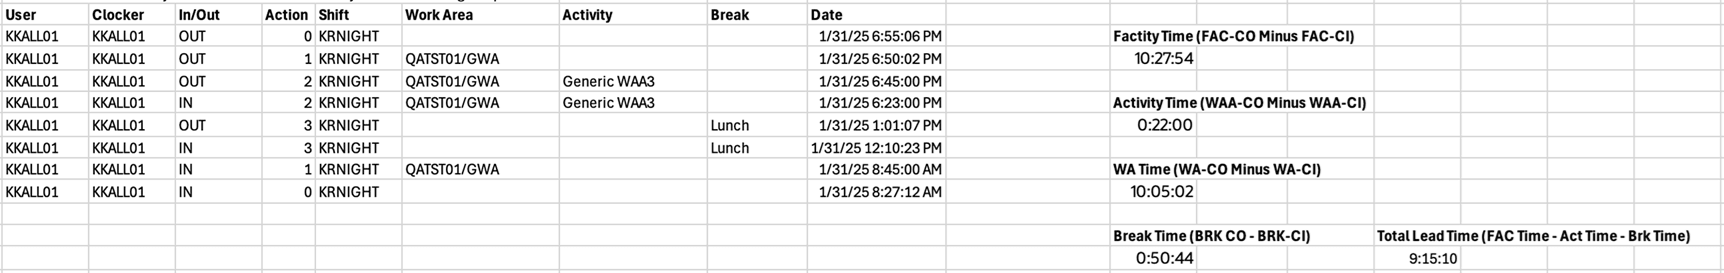
Track Record Data:
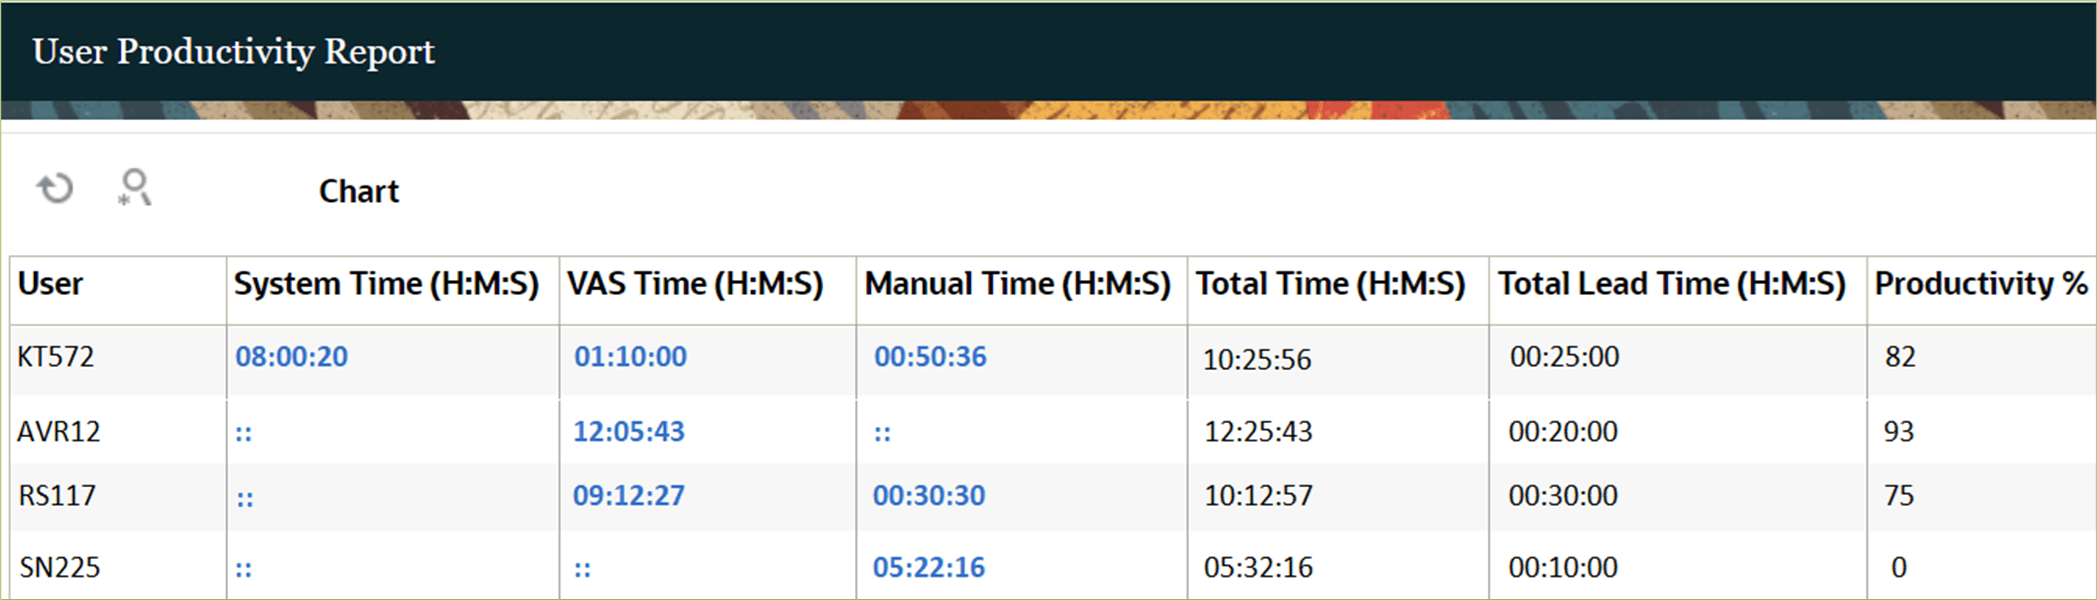
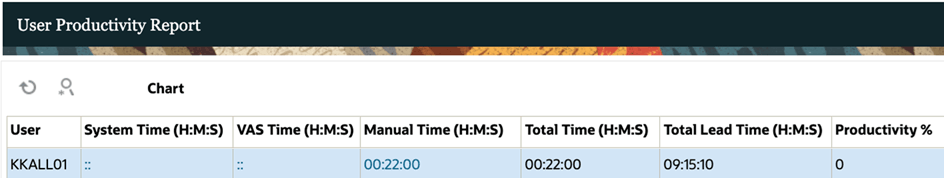
Total Time and Total Lead Time in User Productivity Report:
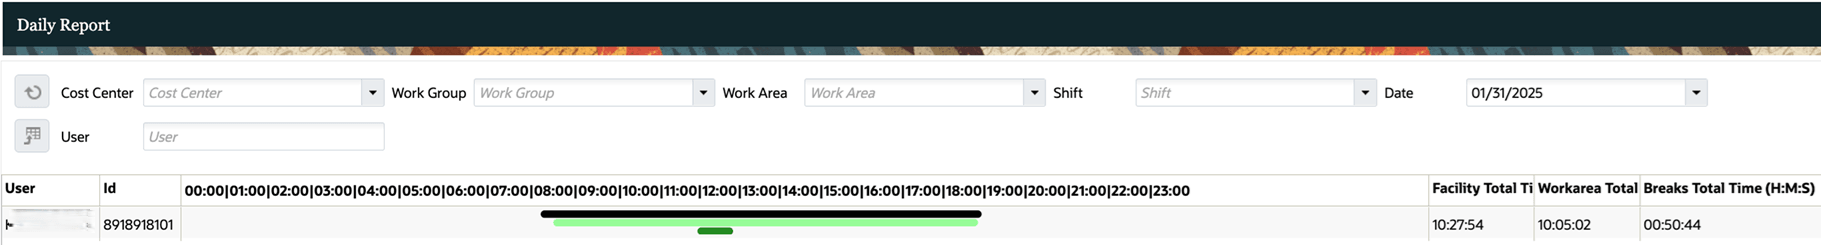
Total Facility Time and Total Break Time in Daily Report:
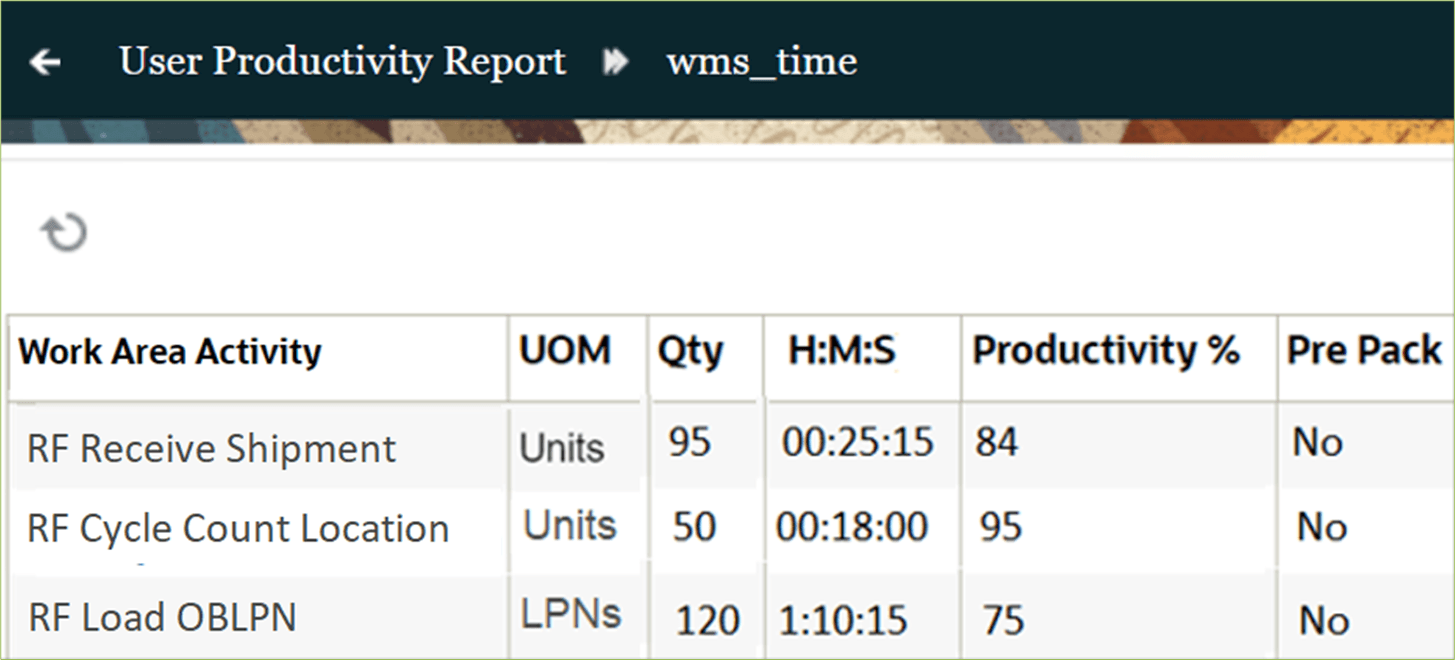
Total time taken by a user on each type of activity can be further drilled down to list all the activities performed by the user.
For example, in the screen above, if the hyperlink for “System Time” is clicked for user KT572, it shows all the WMS activities performed by this user in the requested time period.
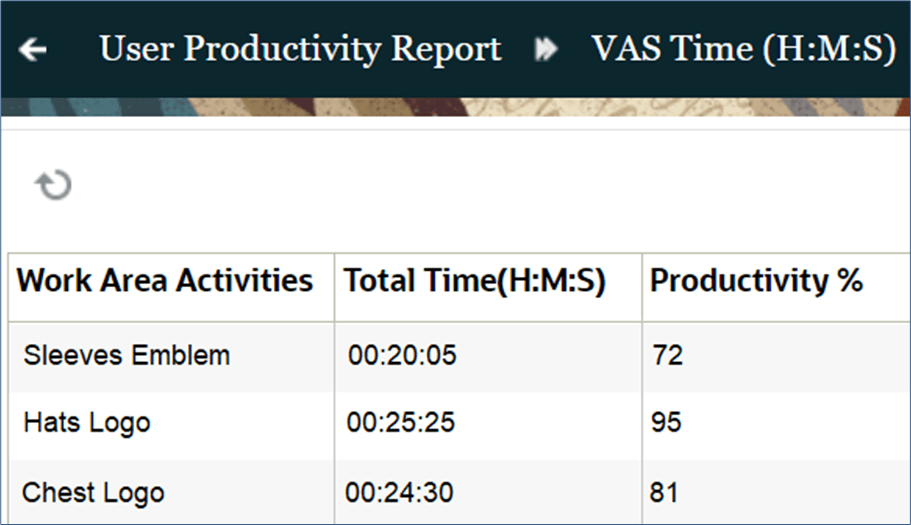
If the hyperlink for “VAS Time” is clicked for user KT572 on the main view, it shows all the VAS activities performed by this user in the requested time period.
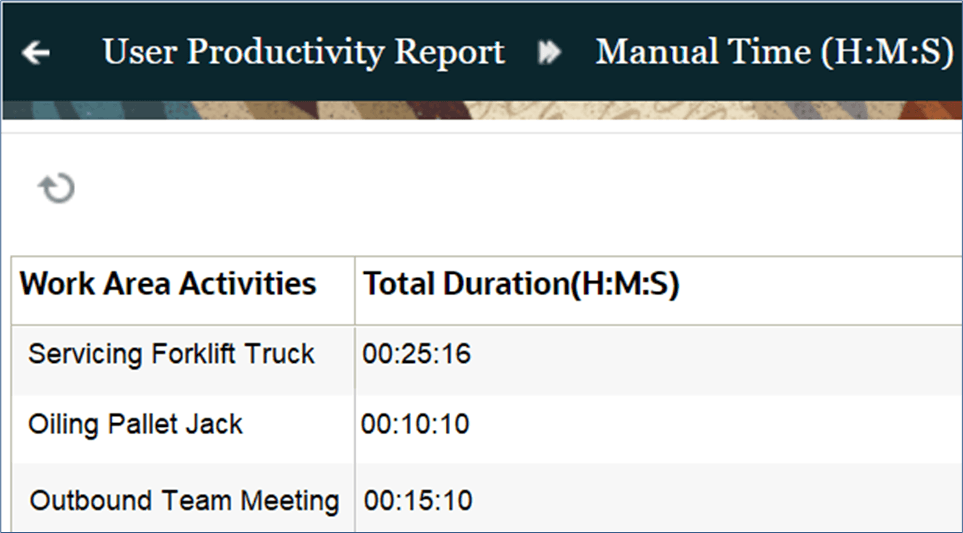
If the hyperlink for “Manual Time” is clicked for user KT572 on the main view, it shows all the Manual activities performed by this user in the requested time period. Note that, since manual activities are not productive, there is no productivity % in this view.
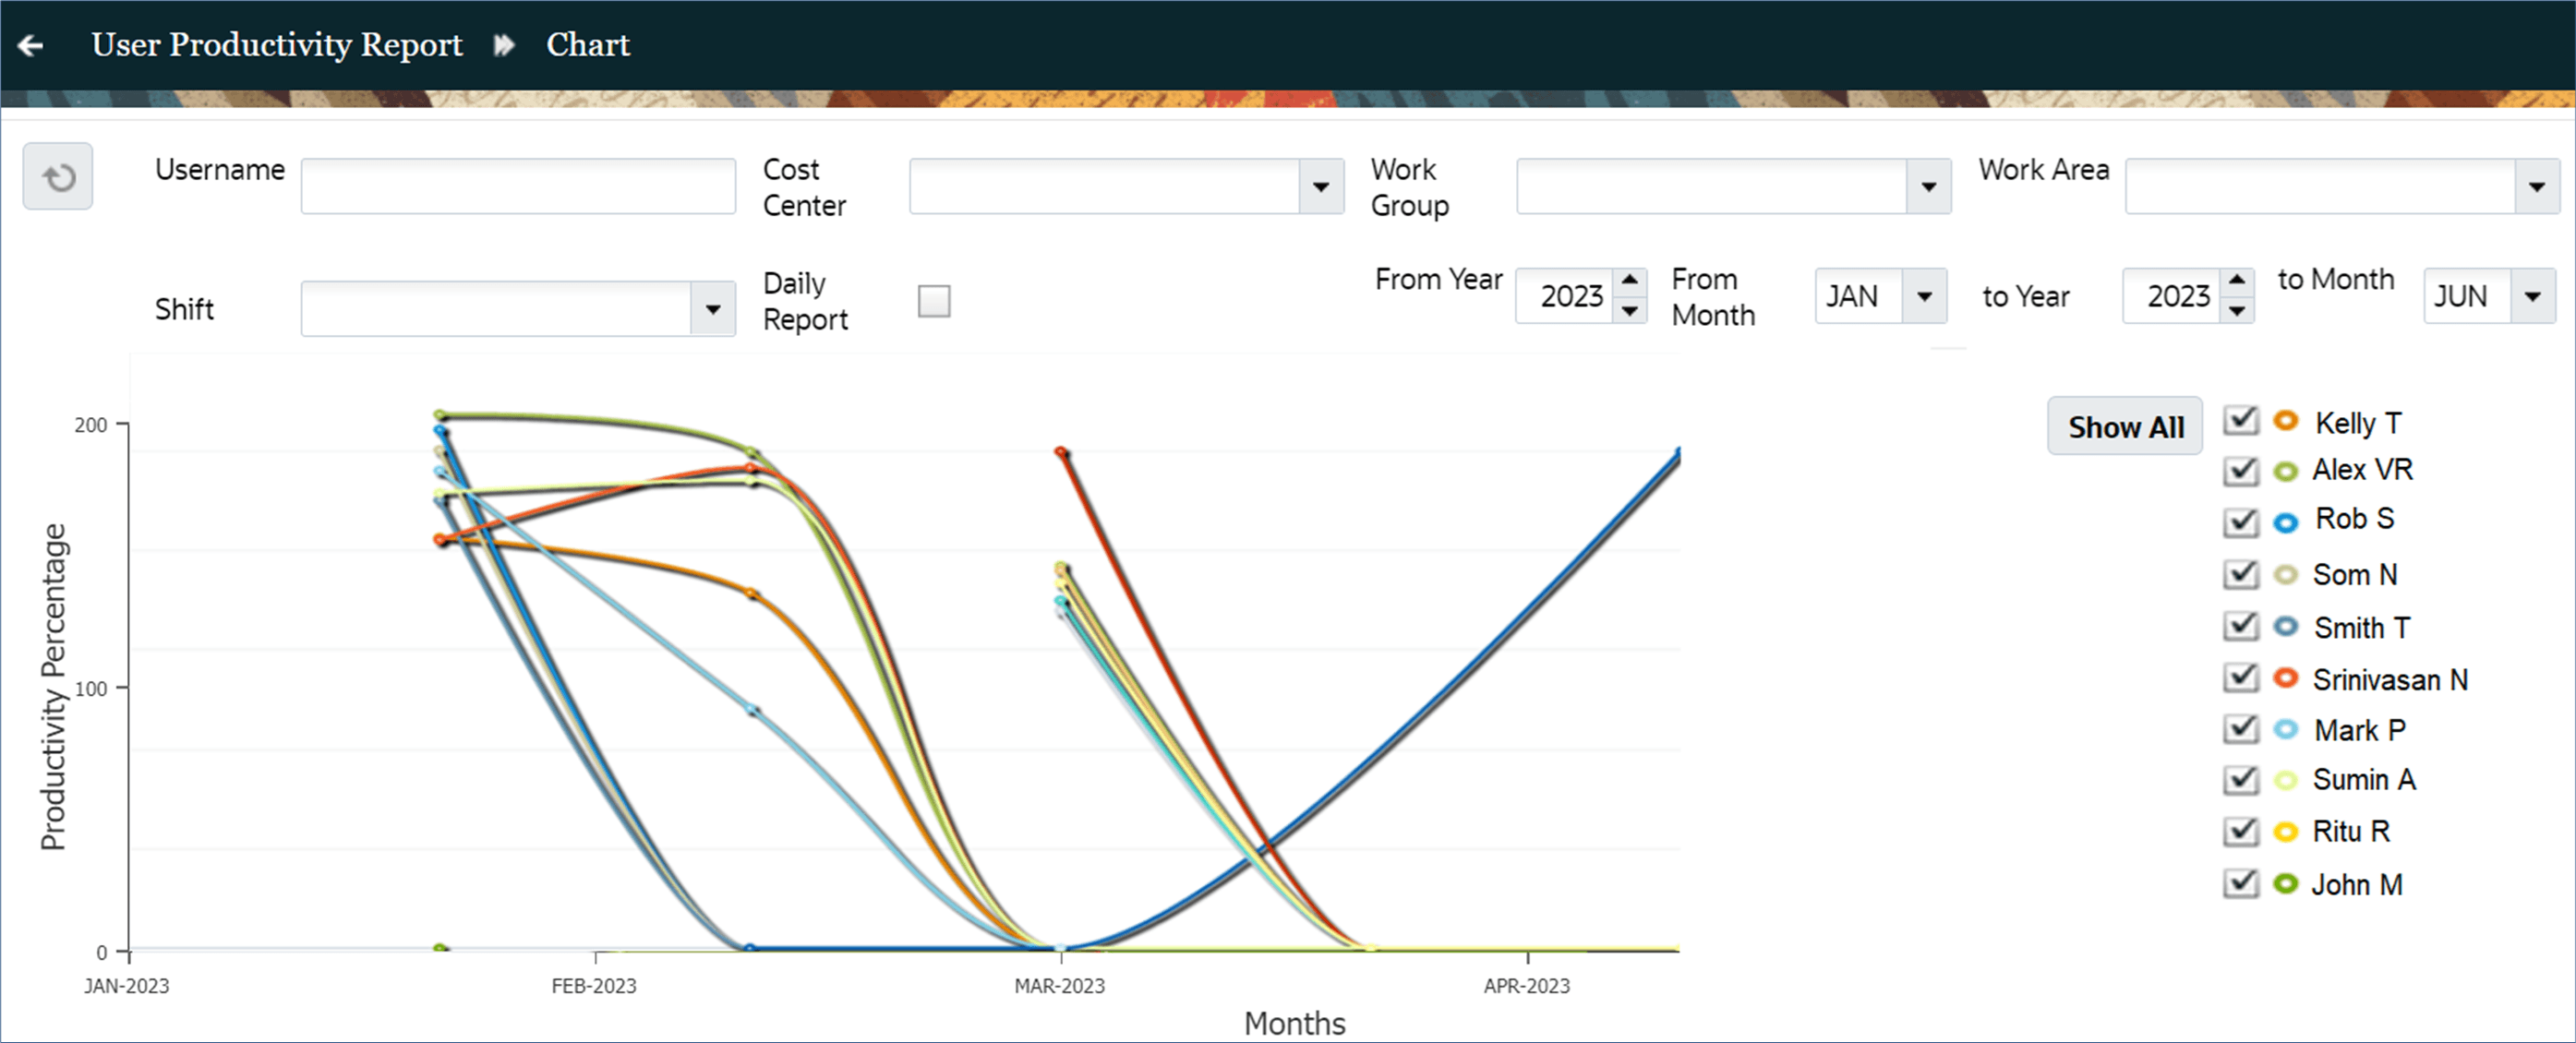
The “Chart” action button on the main view can be used to provide a visual representation in the form of a chart.