Employee Break Metrics
The Break metrics tab on redwood employee dashboard can be used by supervisors to make informed decisions with respect to the organizational policies and improving operational efficiencies. This tab show cases three charts with time-based trend analysis to help you in making more informed operational decisions.
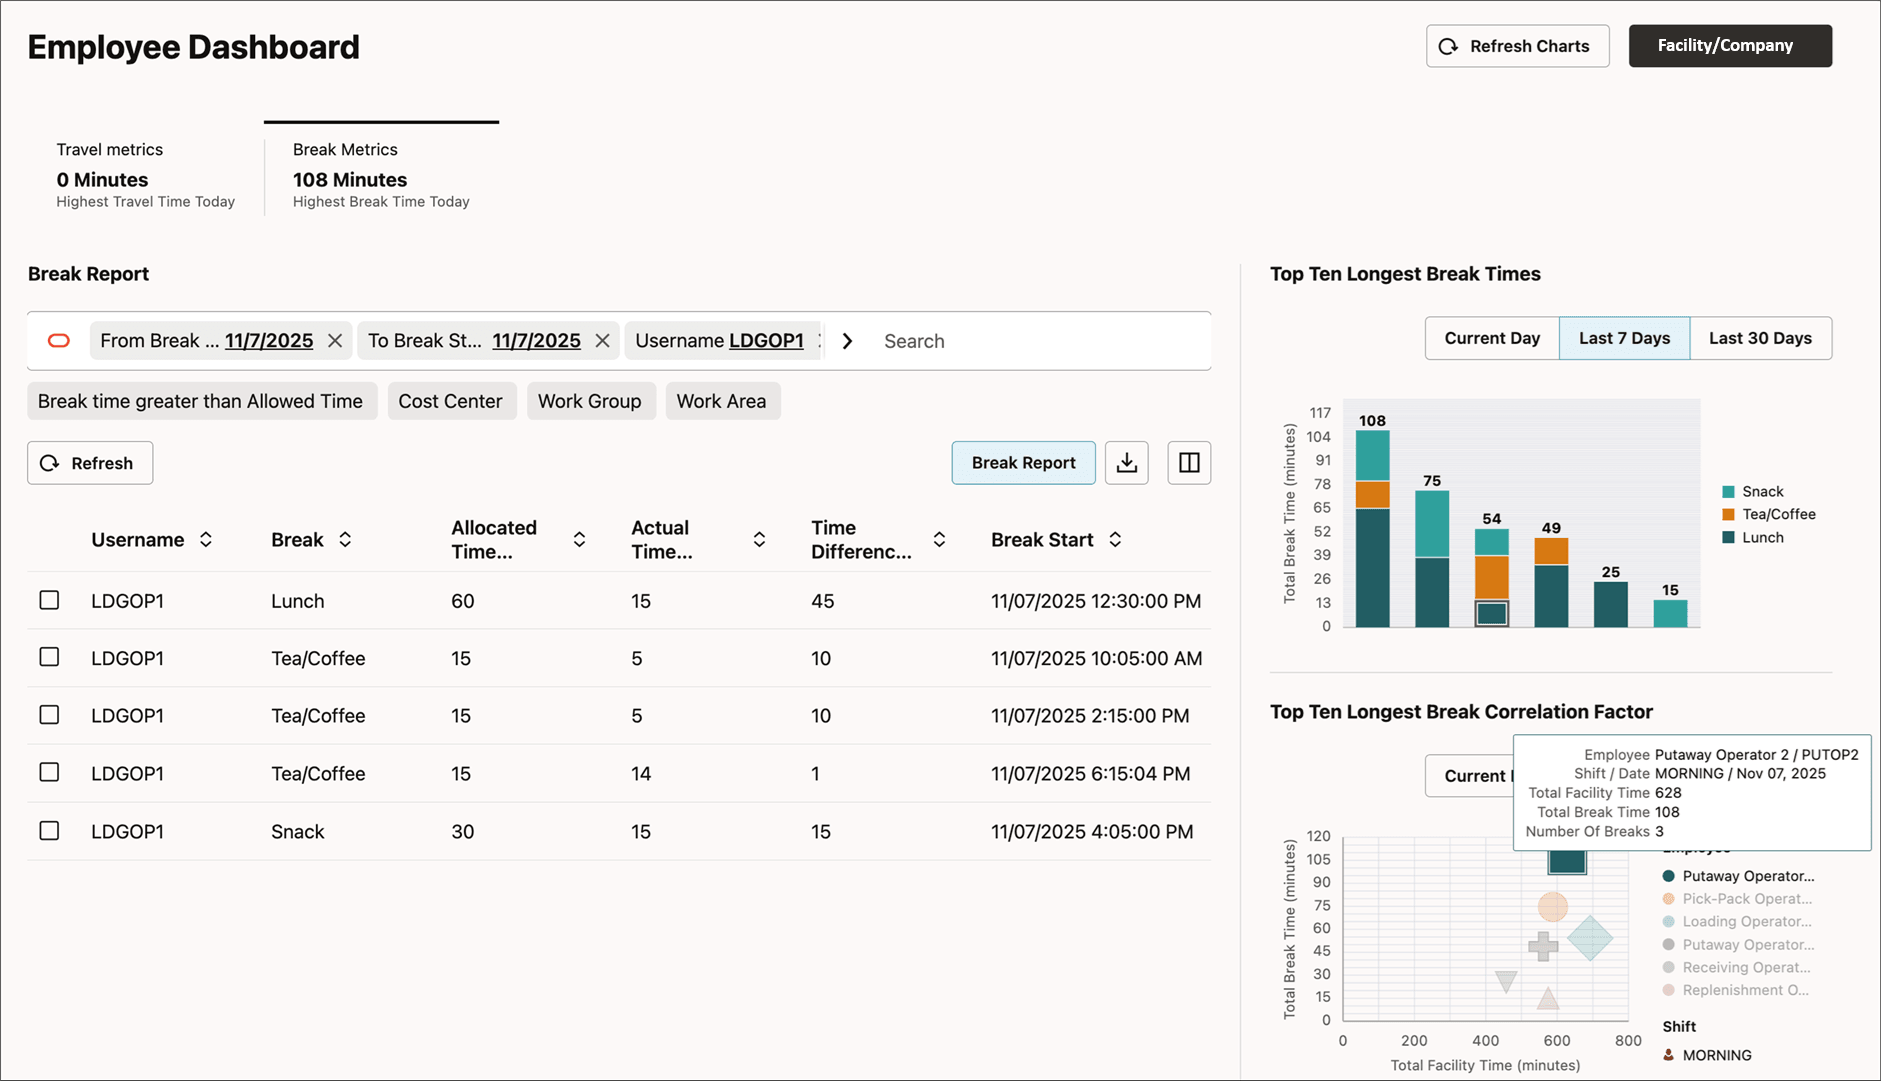
This tab has a report in the form of a data grid that can help you filter and pull up break records of any employee. A stacked bar chart on this tab highlights the top 10 longest break times taken by employees enabling supervisors gain valuable insights such as a certain break contributing to high break times. The bubble chart on this tab can assist supervisors with additional correlation factors such as long work hours or certain shifts that could potentially influence long break times.
Hovering over the datapoints in the stacked or bubble chart provides additional information about each break. You can also drill down further into each datapoint, and the break report is refreshed with the detailed break records of the selected employee.
Toggle buttons are provided on the charts to compare trends between the current day, last 7 or 30 days.