Using Automatic Workload Repository (AWR) Reports for Oracle AI Database
Automatic Workload Repository (AWR) is a good starting point for identifying general database performance issues, which can provide initial indicators to help locate problems with Extract or Replicat processes. Using AWR, you can easily determine if the bottlenecks are inside or outside of the database.
Starting with Oracle AI Database, AWR queries and reports are simplified and enhanced to present the data in an easy to understand view of the replication process. With these report views, it would be easier to troubleshoot replication performance issues by categorizing them as one of the following:
-
Workload issue
-
Database-side misconfiguration issue, such as slow replication SQL due to lack of indexes or wrong database parameter settings
-
Performance bottleneck issue at the database side or in the Oracle GoldenGate processes outside of the database
The replication sections of the enhanced AWR reports include the following features:
-
A more complete Replication System Resource Usage section, which shows the system resource usage for all Oracle GoldenGate replication processes, whether they be foreground or background, and presented for each Extract and Replicat process.
The Replication section also contains information for the XStream IN/OUT interface. For more information about XStream, see Oracle AI Database XStream Guide.
-
A separate section for replication related Top SQL statistics to make it easier to identify replication related SQL performance issues. The number of Top SQL shown is a fraction of the Top SQL shown for the database.
-
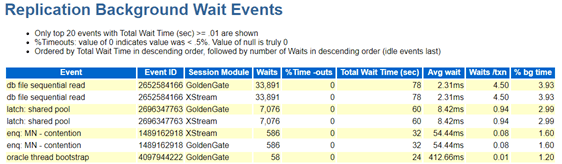
A separate section for top wait events for replication related processes to easily troubleshoot replication related performance problems.
-
Reorganized replication related sections to present the replication statistics organized by individual Extract and different Replicat types.
-
Customized information for Replicat and Extract processes.
Replication System Resource Usage
Oracle GoldenGate replication process name, process type and number of sessions of its sub-components are displayed in the metrics. The performance statistic are aggregated by the functionality of process sub-components, group by process name. This allows the ability to monitor resource usage at per Extract and Replicat, with detailed information of all its sub-components. 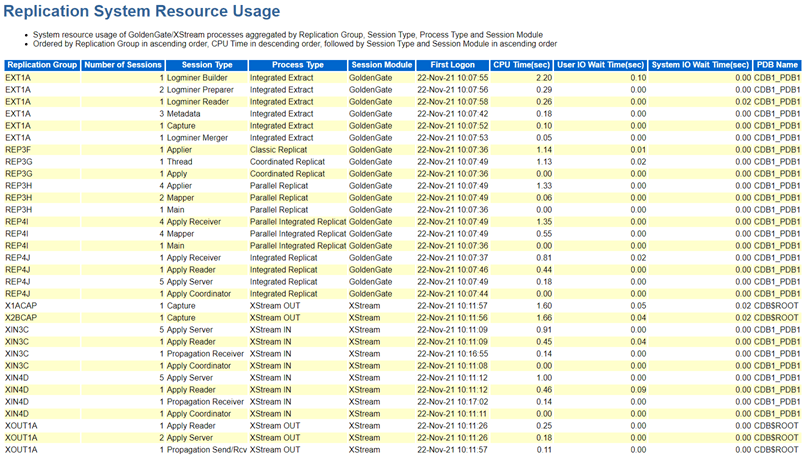
Replication Top Wait Events
Replication foreground and background processes wait events are shown, aggregated by event type, and Oracle GoldenGate SQL Module. 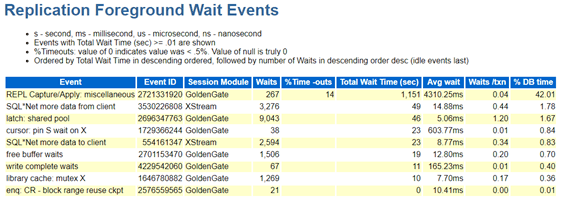
Replication Top SQLs
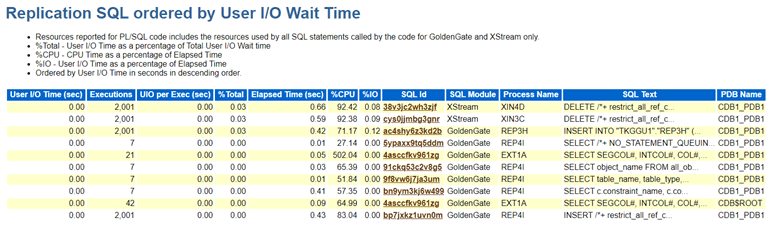
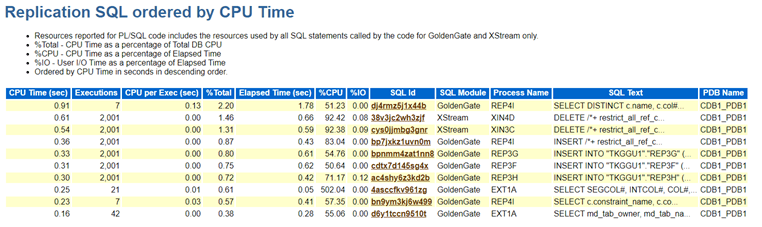
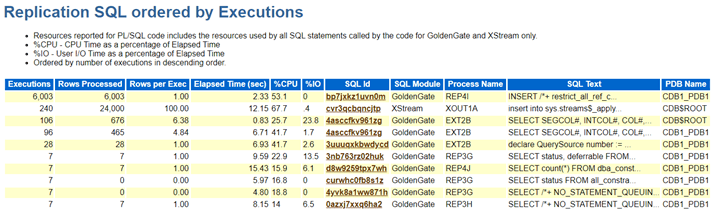
SQLs that are executed by replication processes, displayed in different sections ordered by Elapsed Time, CPU Time and Execution are presented in the Top SQL report. Replication process name is added for identifying the process that is executing the SQL.
Here are examples of the top SQL reports. 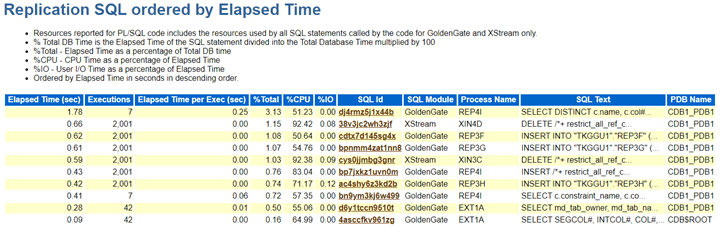
Oracle GoldenGate Extract Performance Metrics
This section shows the performance metrics for Extract and the capture engine. 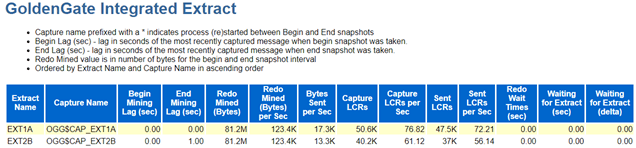
The following table describes the performance metric data.
Note: Unless noted all data are cumulative delta collected in the snapshot interval.
| Metrics Name | Description |
|---|---|
| Extract Name | GoldenGate Extract |
| Capture Name | Capture process name |
| Begin Mining Lag(s) | Lag (in seconds) derived by the time when the most recent LCR was created and received. This lag was measured at the beginning of the snapshot. |
| End Mining Lag(s) | Lag (in seconds) derived by the time when the most recent LCR was created and received. This lag was measured at the end of the snapshot. |
| Redo Mined (Bytes) | The amount of redo data mined (in bytes). If the process was restarted within the snapshot interval, then an asterix (*) appears. |
| Redo Mined (Bytes) per sec | Redo Mined Rate |
| Bytes Sent per Sec | Number of bytes sent by the Capture process to the Extract process since the last time the Extract process attached to the Capture process. |
| Capture LCRs | Number of LCRs delivered to the Capture from Logminer |
| Capture LCRs per Sec | Capture LCRs Rate |
| Sent LCRs | Number of LCRs sent from the Capture to the Extract |
| Sent LCRs/Sec | Sent LCRs Rate |
| Redo Wait Times(sec) | Time spent by the Capture process in the WAITING FOR REDO state. |
| Waiting for Extract(sec) | The Capture waiting time for requests from the Extract. At the end of Snapshot |
| Waiting for Extract (delta) | Delta value of Waiting for Extract time between the begin snap and the end snap |
Oracle GoldenGate Integrated Replicat
This section shows the performance statistics for Oracle GoldenGate integrated Replicat. 
The following table describes the metric data.
| Metric Name | Description |
|---|---|
| Replicat Name | Oracle GoldenGate Replicat name |
| Apply Name | Apply process name |
| LCRs Buffered (Reader) | Number of LCRs buffered waiting to be processed by Apply Reader |
| Txns Received (Coordinator) | Number of transactions received by Apply Coordinator |
| Txns Not Assigned (Coordinator) | Number of transactions not assigned yet by Apply Coordinator |
| LCRs Applied (Apply Server) | Number of LCRs applied by Apply Server |
| LCRs/Sec Applied (Apply Server) | LCRs apply rate by Apply Server |
| LCRs with Dependencies % | Percentage of LCRs having to wait for other transactions due to dependency |
| LCRs with Watermark Dependency % | Percentage of LCRs having to wait due to source transaction commit ordering |
| Total Errors | Total transaction with errors |
Oracle GoldenGate Replicat
This section shows overall performance statistics of Oracle GoldenGate classic Replicat, coordinated Replicat, and parallel Replicat. The statistics of SQL operations are aggregated for each Replicat process. 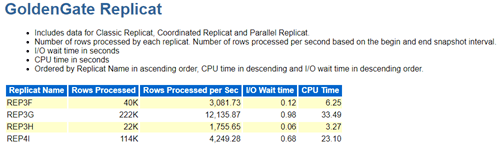
The following table describes metric data.
| Metric Name | Description |
|---|---|
| Replicat Name | Replicat Name |
| Rows Processed | Number of rows processed by SQL operations by the Replicat |
| Rows Processed per Sec | Rows Processed Rate |
| I/O Wait Time | User I/O Wait Time of SQL operations by the Replicat |
| CPU Time | CPU Time of SQL operations by the Replicat |