3.1 About Interactive Grids
Interactive grids feature many ways to change how the data is displayed, including the Actions menu and the Column Heading menus. You can also rearrange the grid interactively using the mouse.
Interactive Grid Interface
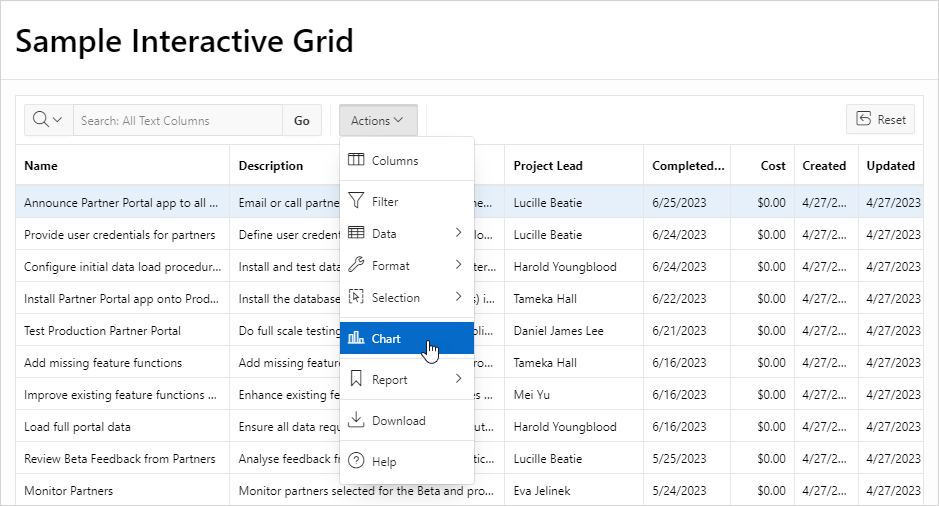
By default, all interactive grids have a search bar, Actions menu, and Reset button. Interactive grids also have Column Heading Menus, which you access by clicking the name or heading of a column.
You can hide, filter, freeze, highlight, sort, and create control breaks on individual columns with the Actions and Column Heading menus. Advanced users can also define aggregations, which appear at the bottom of the column or column group.
Using the mouse, you can resize columns or drag and drop columns into different places to directly customize the appearance of an interactive grid. You can also configure the width and order of columnsin the Columns dialog.
You can quickly chart the data by clicking the Actions menu and selecting the Chart option. This feature is useful for quick data visualization or even presentation, and responds immediately to changes in the data.
You can quickly revert your modifications with the Reset function or perform an incremental revert by clicking the Actions menu and selecting, Data, Flashback. You can use the Refresh option to pull in the latest version of the data on the database (useful for highly dynamic datasets).
Reports in Interactive Grids
You can save your customizations to an interactive grid by creating a custom report by selecting Report, Save As from the Actions menu.
See Also:
Parent topic: Using Interactive Grids
