8.9.1 Example Interactive Report
View an interactive report example.
An interactive report is a formatted result of a SQL query. End users can customize the both report layout and control how the data that displays. Both the Create Application Wizard and Create Page Wizard support the creation of interactive reports. You choose a table on which to build a report, or provide a custom SQL SELECT statement. Interactive reports are only supported for Desktop applications.
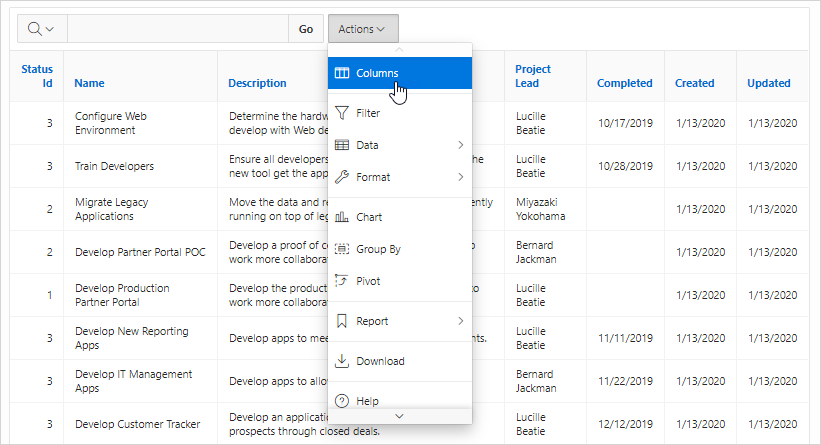
End users can customize the report layout and data displayed by selecting options on the Actions menu. For example, end users can alter the report layout by hiding or exposing specific columns and applying filters, highlighting, and sorting. Advanced end users can also define breaks, aggregations, charts, group data, and add computations. Once customized, the report can be saved as either a private or public report.
The following is an example of an interactive report.
Developers can include multiple interactive reports per page and can restrict the capabilities available to end users (such as disabling download or support for hiding column). When the end user views the report, report functionality is the same across all reports in the application.
When viewing an interactive report, end users can customize how and what data displays. By default, interactive reports include a search bar, an Actions menu, column heading menus, and Edit icons in the first column of each row. Using options on the Actions menu, users can alter the report layout by hiding or exposing specific columns and applying filters, highlighting, and sorting. They can also define breaks, aggregations, charts, group bys, and add their own computations. Once customized, the report can be saved as either a private or public report.
Tip:
To view an example, install the sample app, Sample Reporting. To learn more, see Installing Apps from the Gallery.
See Also:
Using Interactive Reports in Oracle APEX End User’s Guide
Parent topic: Managing Interactive Reports
