Conveying Quantities with a Heat Map
A Heat Map layer associates an additional quantity to a point to convey how that value differs at different points on the map.
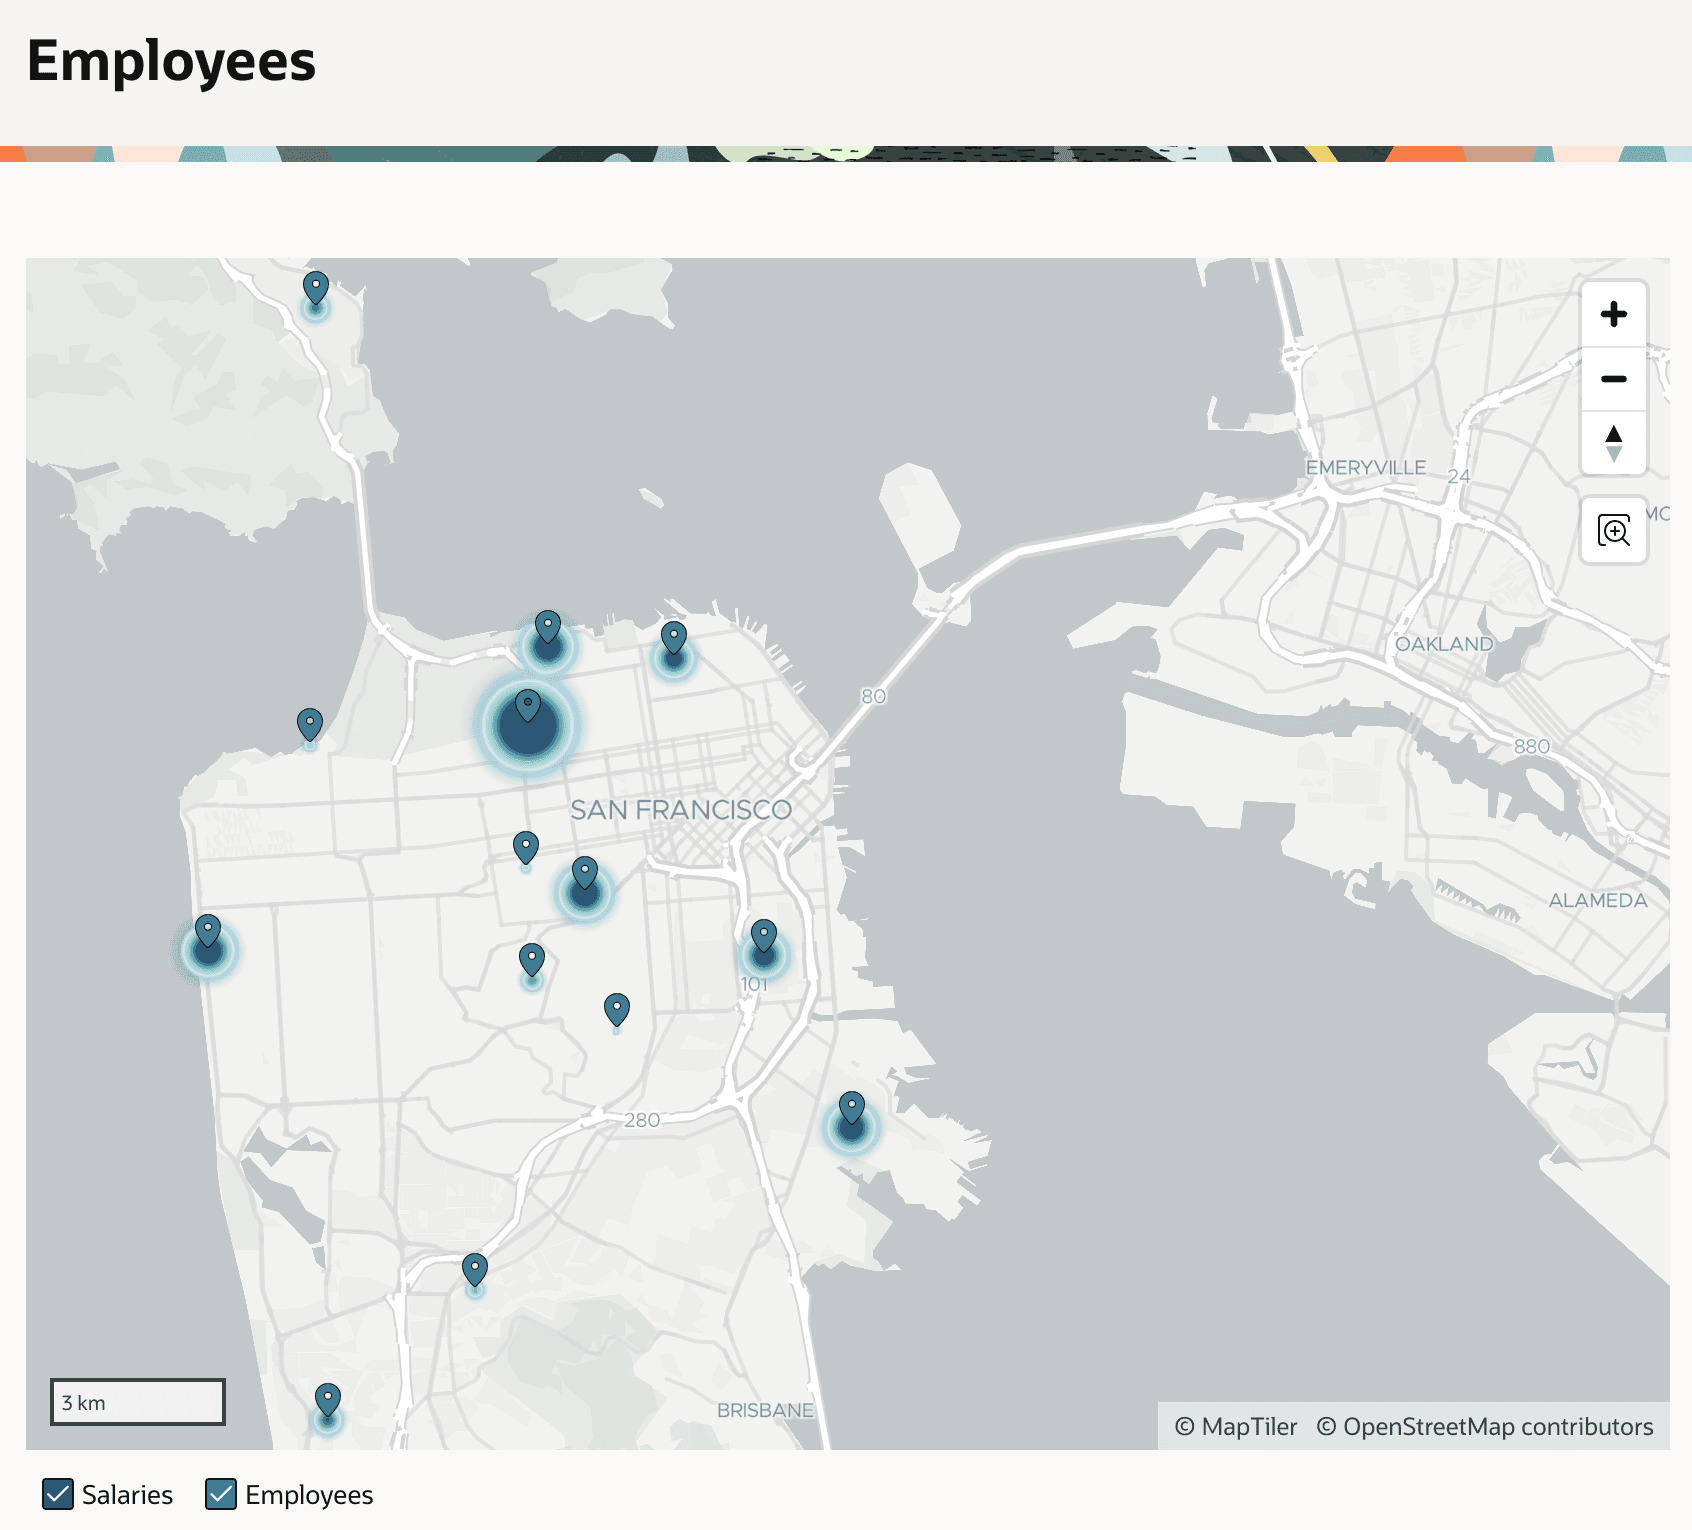
After adding an additional Salaries heat map layer, using TOTAL_COMPENSATION as the value column, the page looks like the figure below when both layers are displayed. Each employee’s address marker now shows a circle sized proportionally to their total pay relative to their peers.