Inspecting Session State for Debugging
When running your app from App Builder, the developer toolbar appears along the edge of the browser window and offers options useful for debugging.
Clicking the developer toolbar’s Session > View Session State option opens a window with the session state browser. The figure below shows developer LUCY browsing her current session state for page 44 of the Onboard New Employee wizard. It shows the values of all page items stored persistently for the active user session.
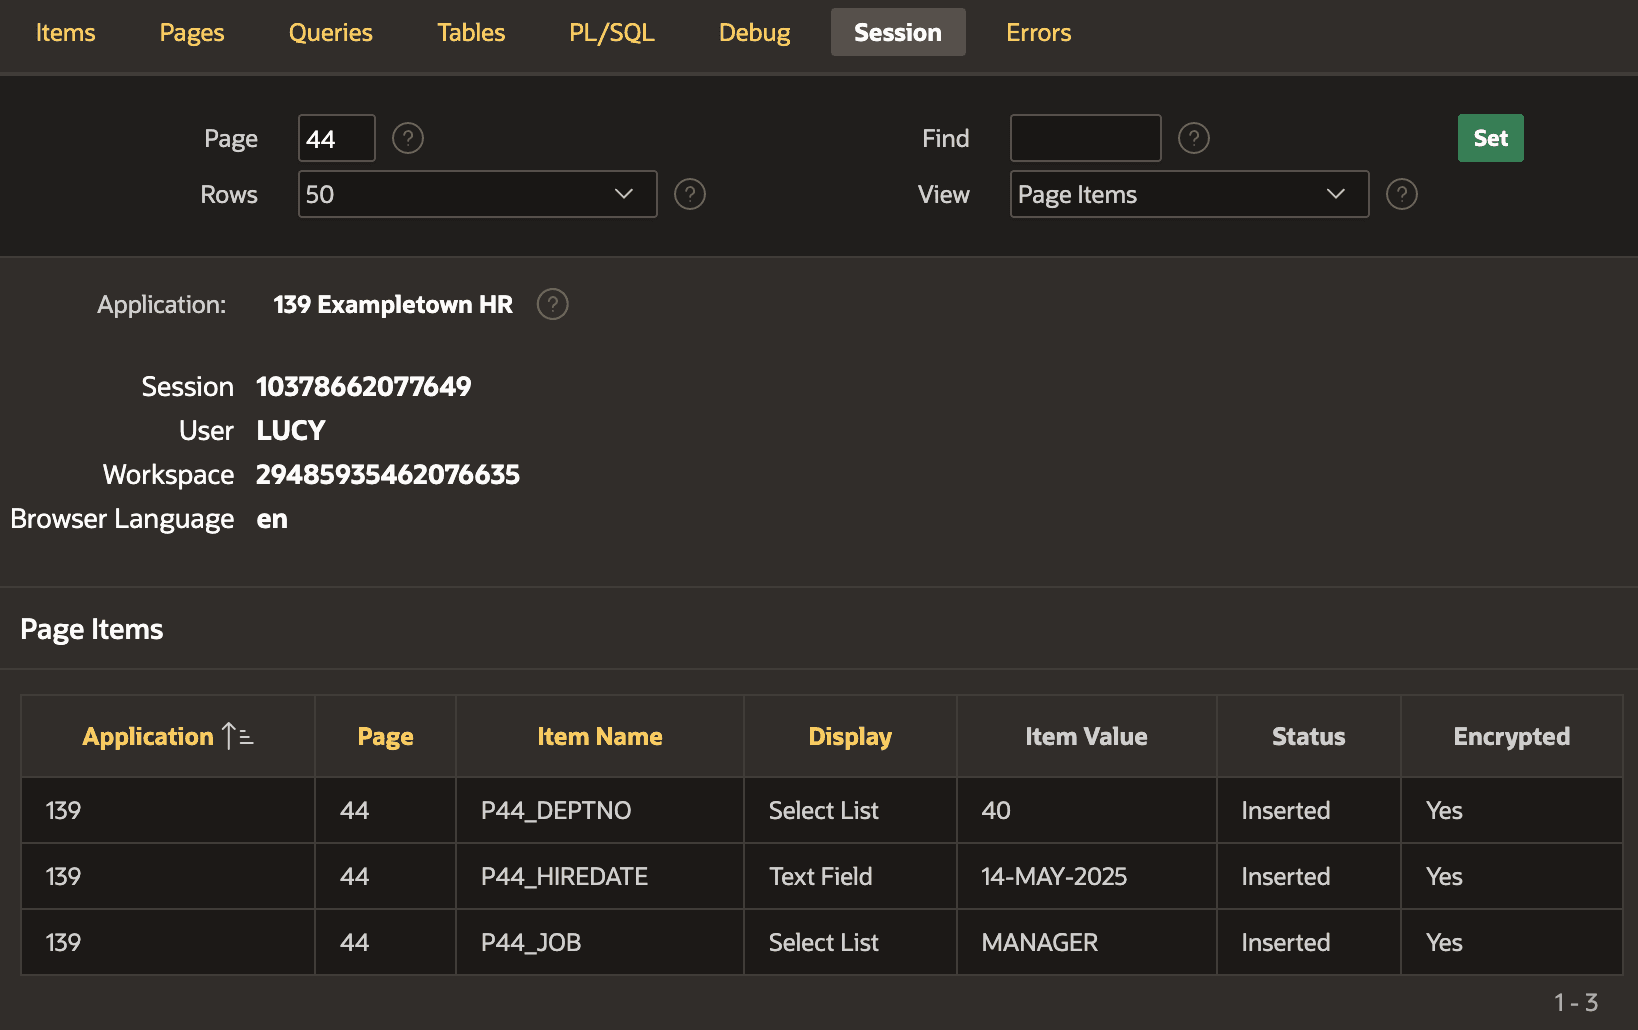
Description of the illustration session-state-browse-pageitems.png
As shown below, you can also view application items, collections, and background executions. All of this information is useful when trying to understand why your APEX application is not working as you expected. The figure shows the Session tab of the session state viewing page, with the View select list open containing session state types you might need to inspect.
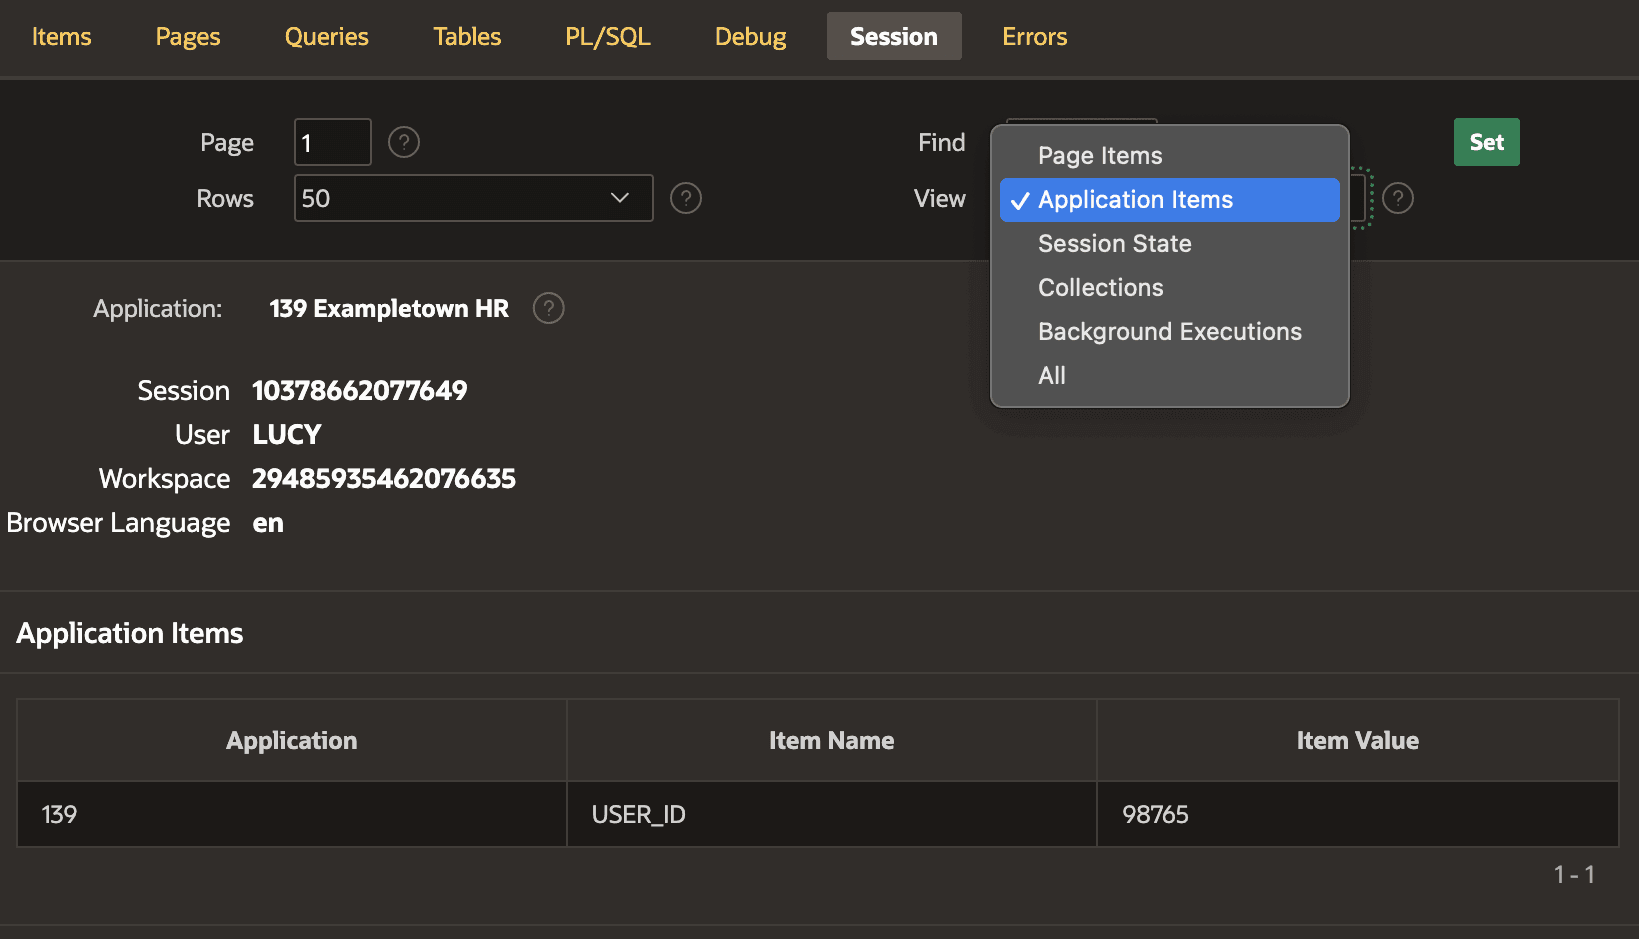
Description of the illustration session-state-browse-others.png