Investigating Background Process Errors
Investigate failed background jobs by reviewing their debug trace logs and error details.
When a background job encounters an unexpected error, start with the Debug Viewer page’s Session tab. Set View to Background Executions and click (Set). Then filter for jobs with a Failed status as shown below.
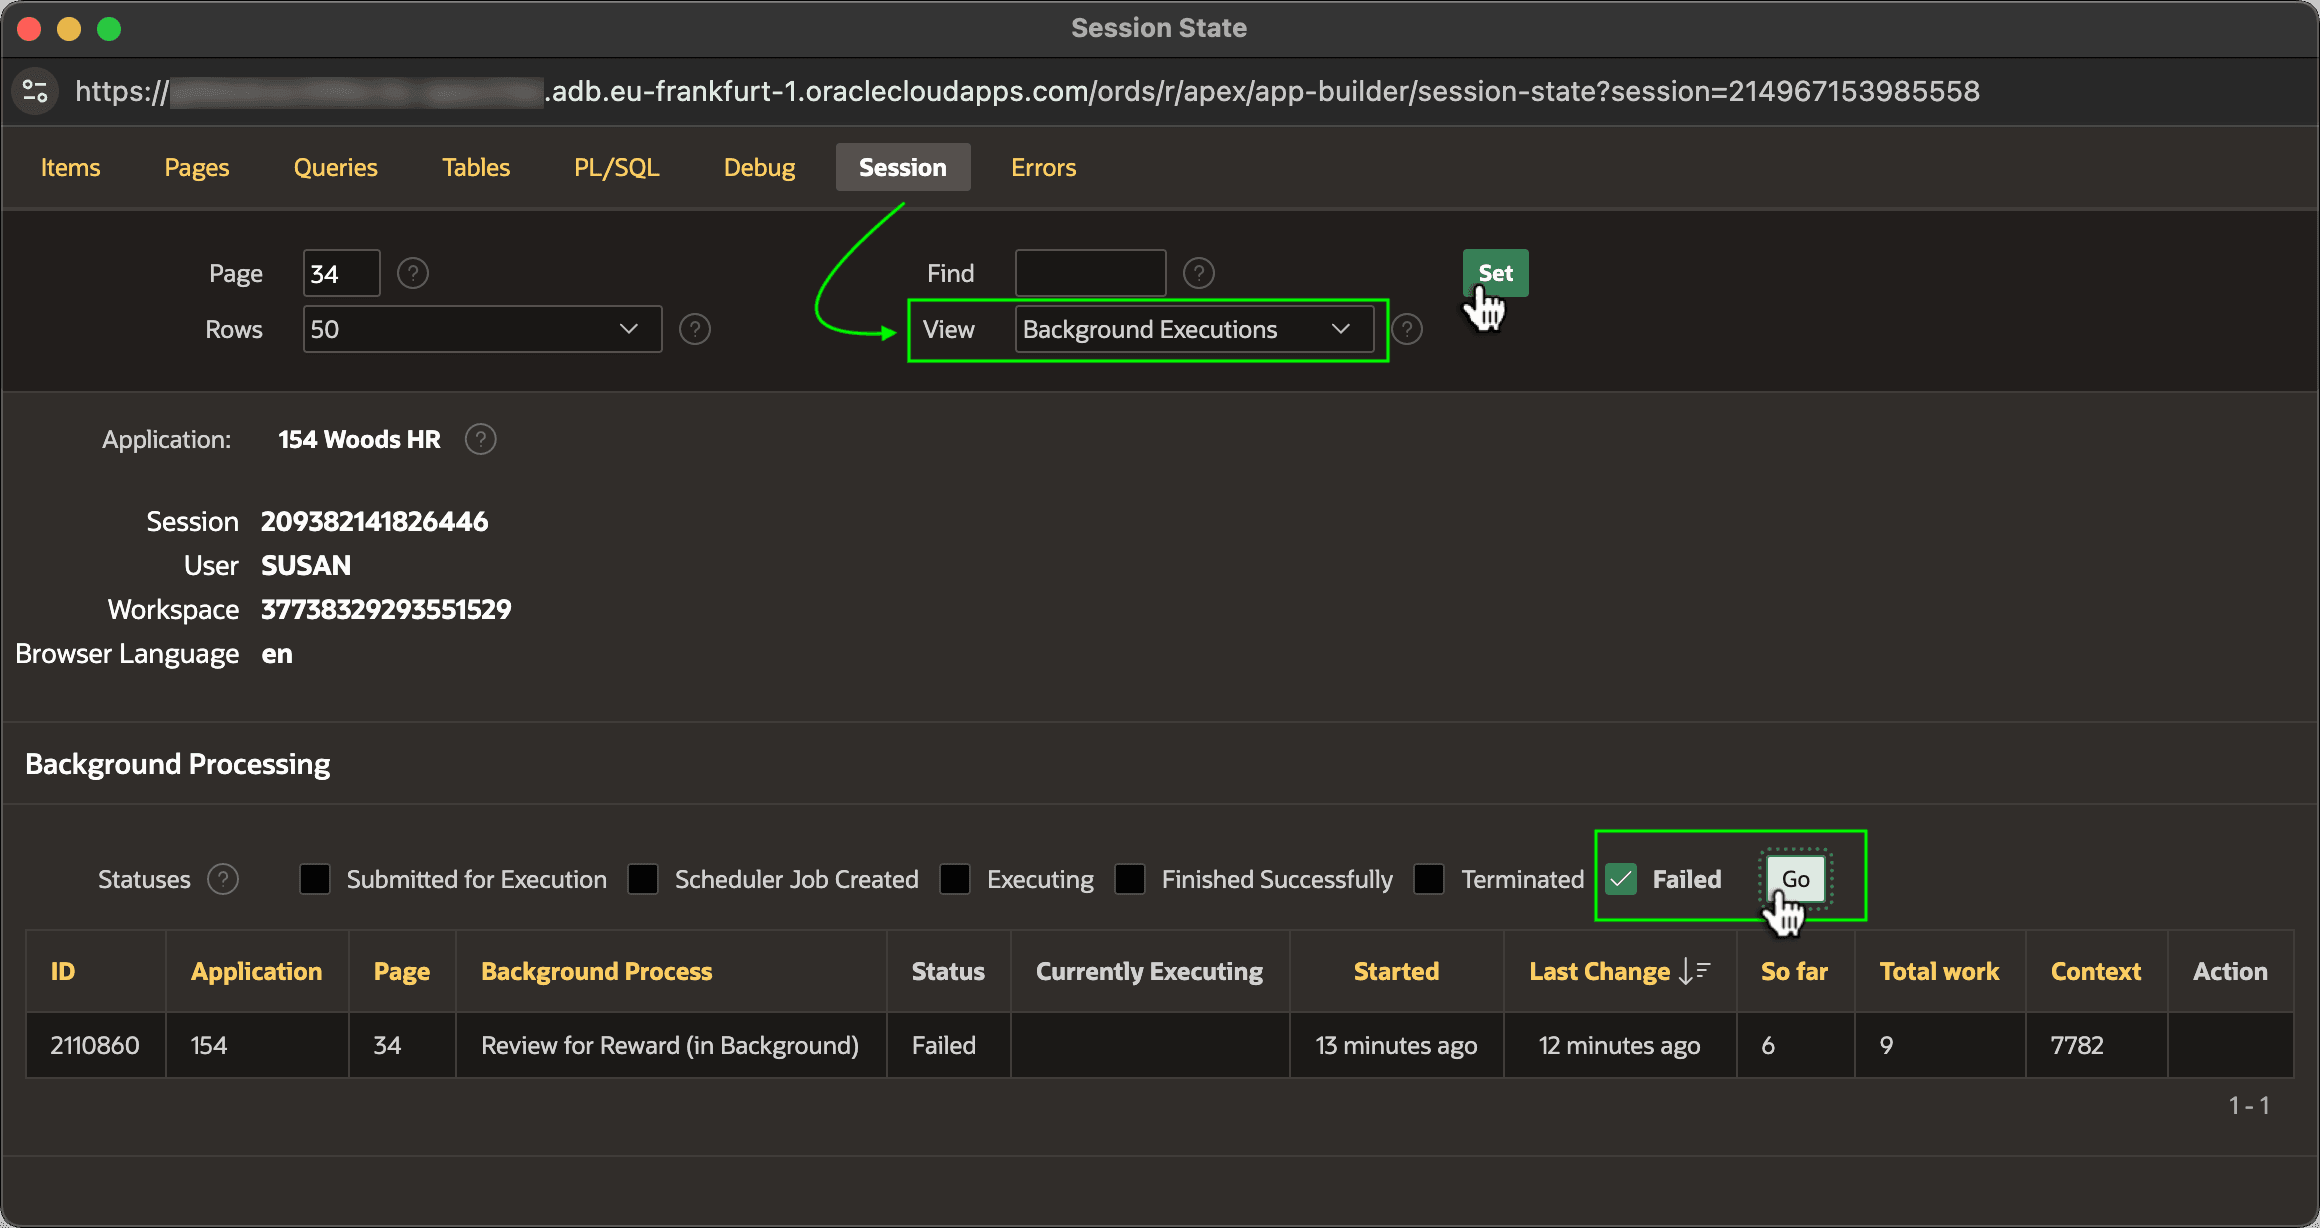
Description of the illustration viewing-failed-background-jobs.png
Then, on the Debug tab sort descending by Timestamp and drill into the debug trace log for the candidate process as shown below.
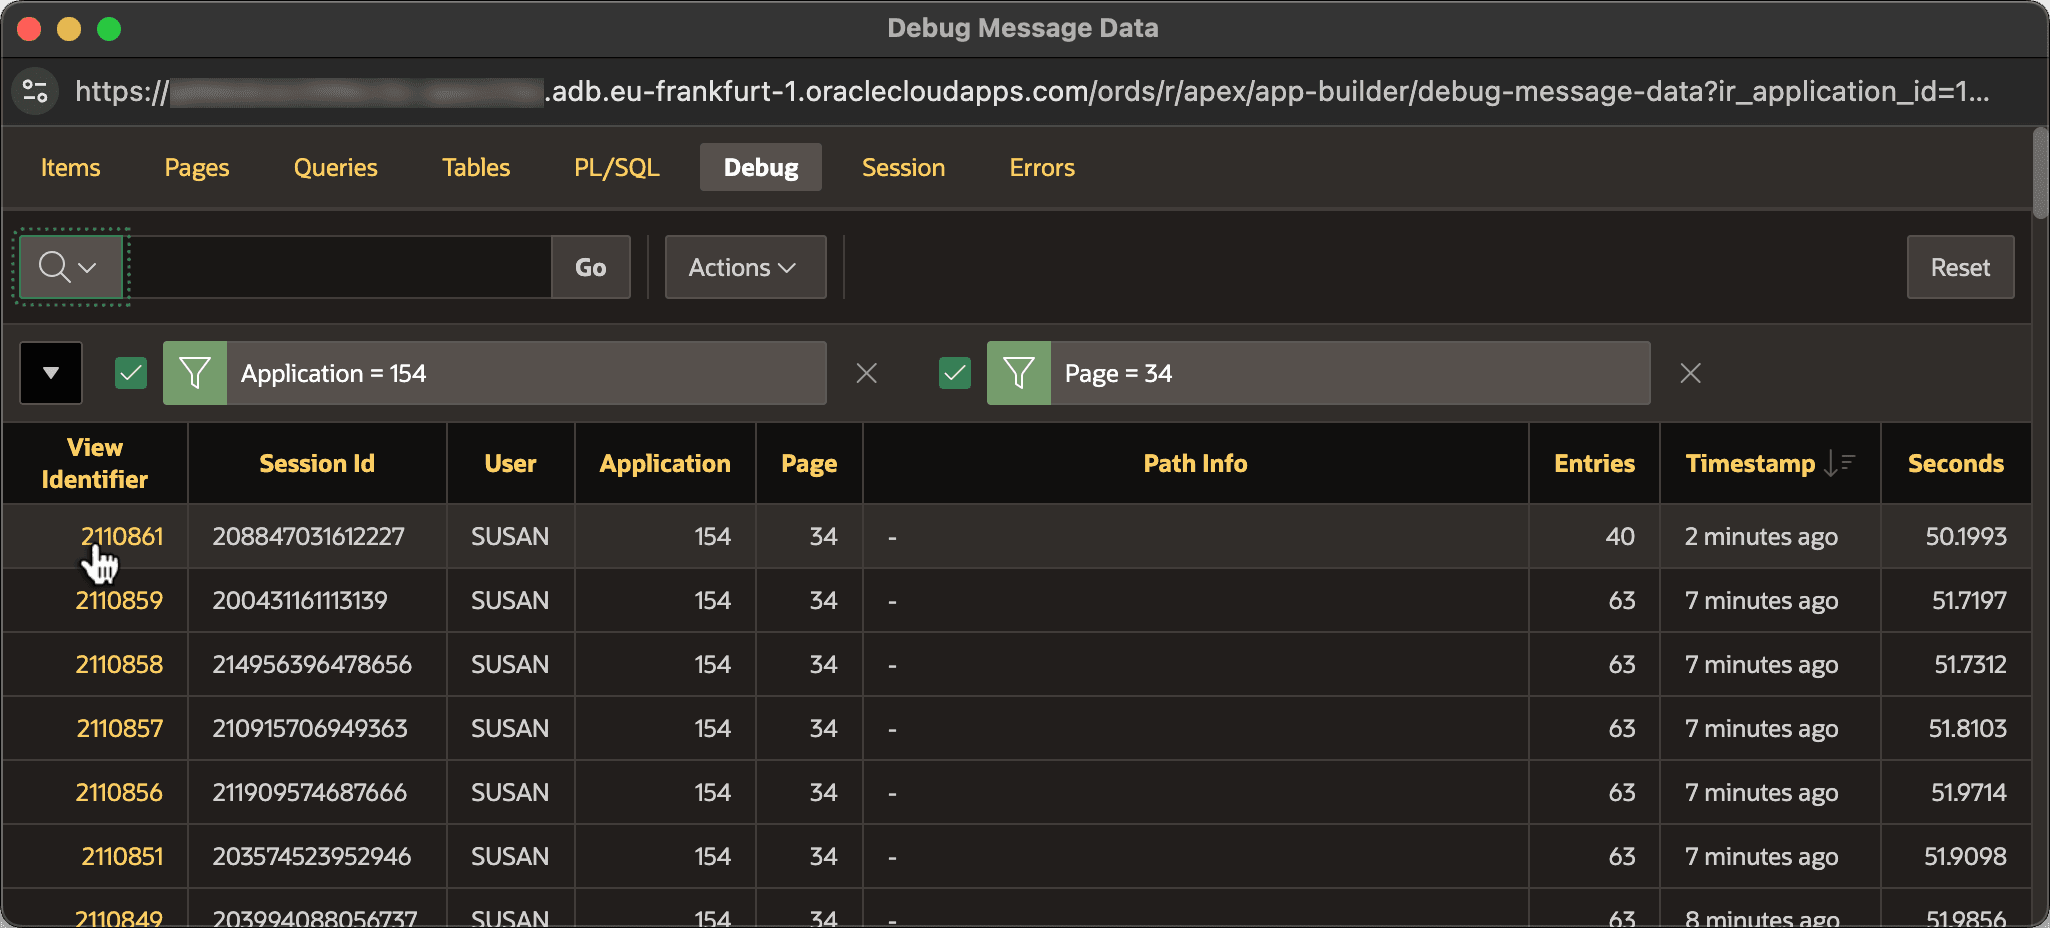
Description of the illustration finding-debug-trace-details.png
Any errors that occurred show as red dots on the debug trace timeline. As shown below, click the first red dot to jump to the relevant part of the debug trace log.
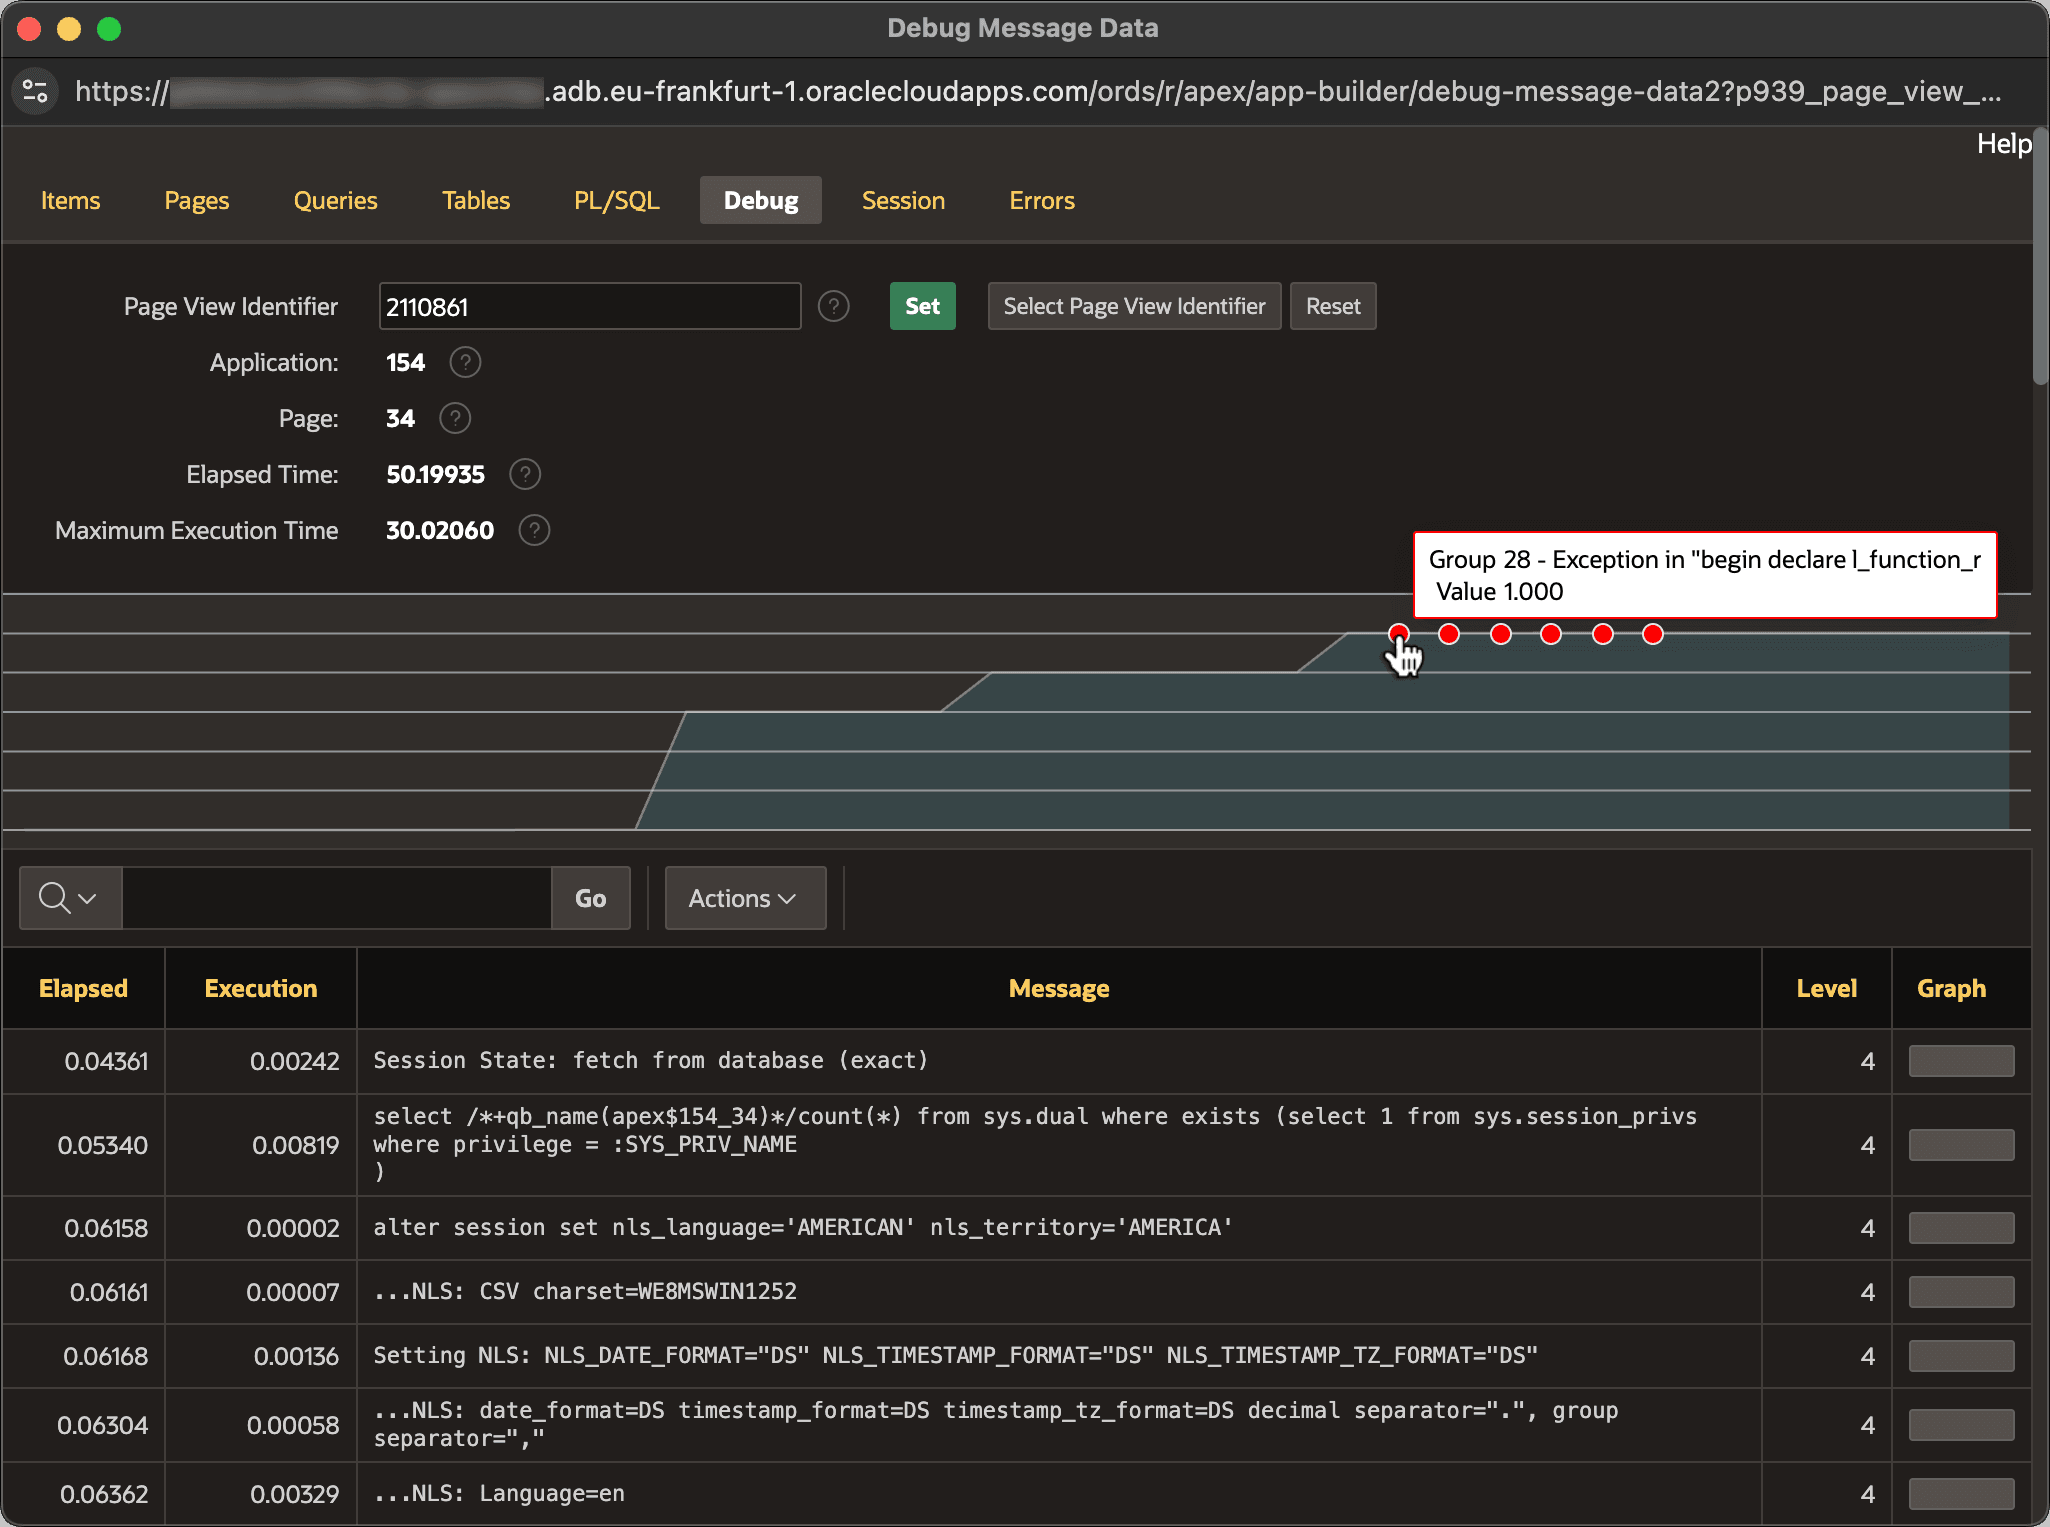
Description of the illustration jumping-first-error-timeline.png
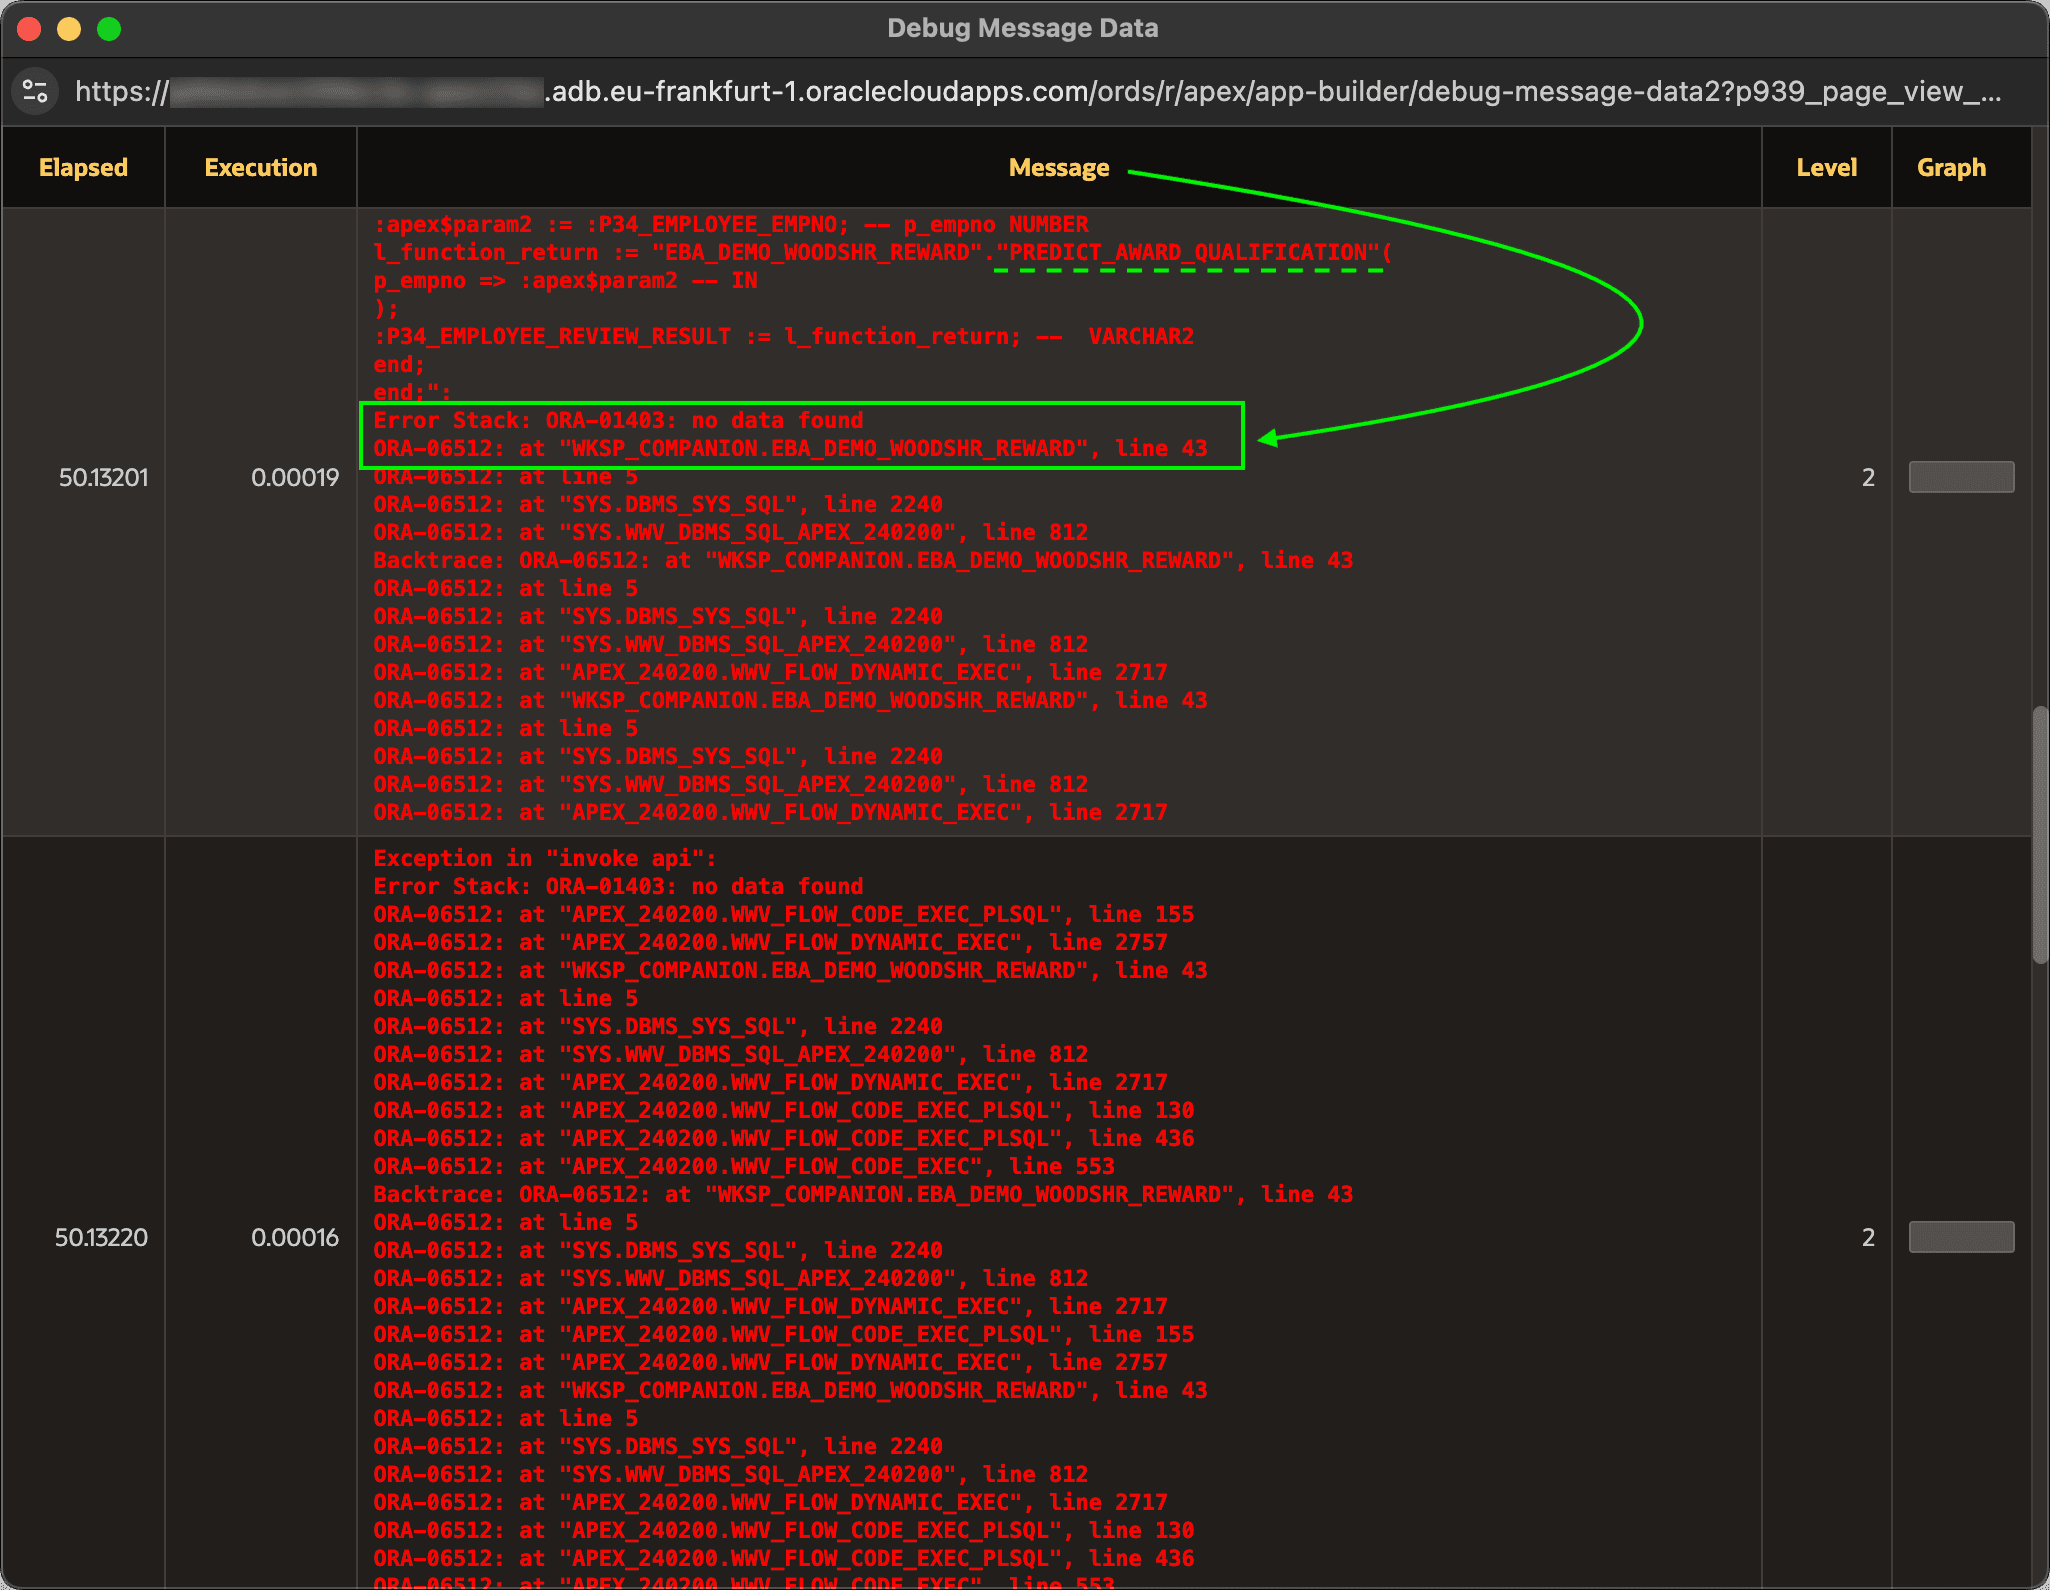
Review the error information. As shown below, the stack trace helps you see that line 43 of the EBA_DEMO_WOODSHR_REWARD package encountered a NO_DATA_FOUND exception during the execution of the Invoke API that calls PREDICT_AWARD_QUALIFICATION. With this info, you can more quickly identify the cause in your code.
When needed, you can enable debug mode and add additional APEX_DEBUG.INFO debugging messages into your code to add extra debugging context information to the logs to further narrow down the culprit.