Viewing Debug Trace Information
View workflow debug traces by clearing page filters in the Debug Message Data window.
Use the Developer Toolbar’s Debug > View Debug menu option to open the Debug Message Data window shown below. By default, the Interactive Report showing debug trace requests is filtered by the current application id and the current page. Since workflow activities execute in the background, they are not associated to a page. They also have no logged-in username. To see the workflow debug messages, as shown below, either:
-
Disable the Page filter by unchecking its checkbox, or
-
Clear the Page filter by clicking its “x” icon.
Then workflow messages for user nobody with no associated page appear.
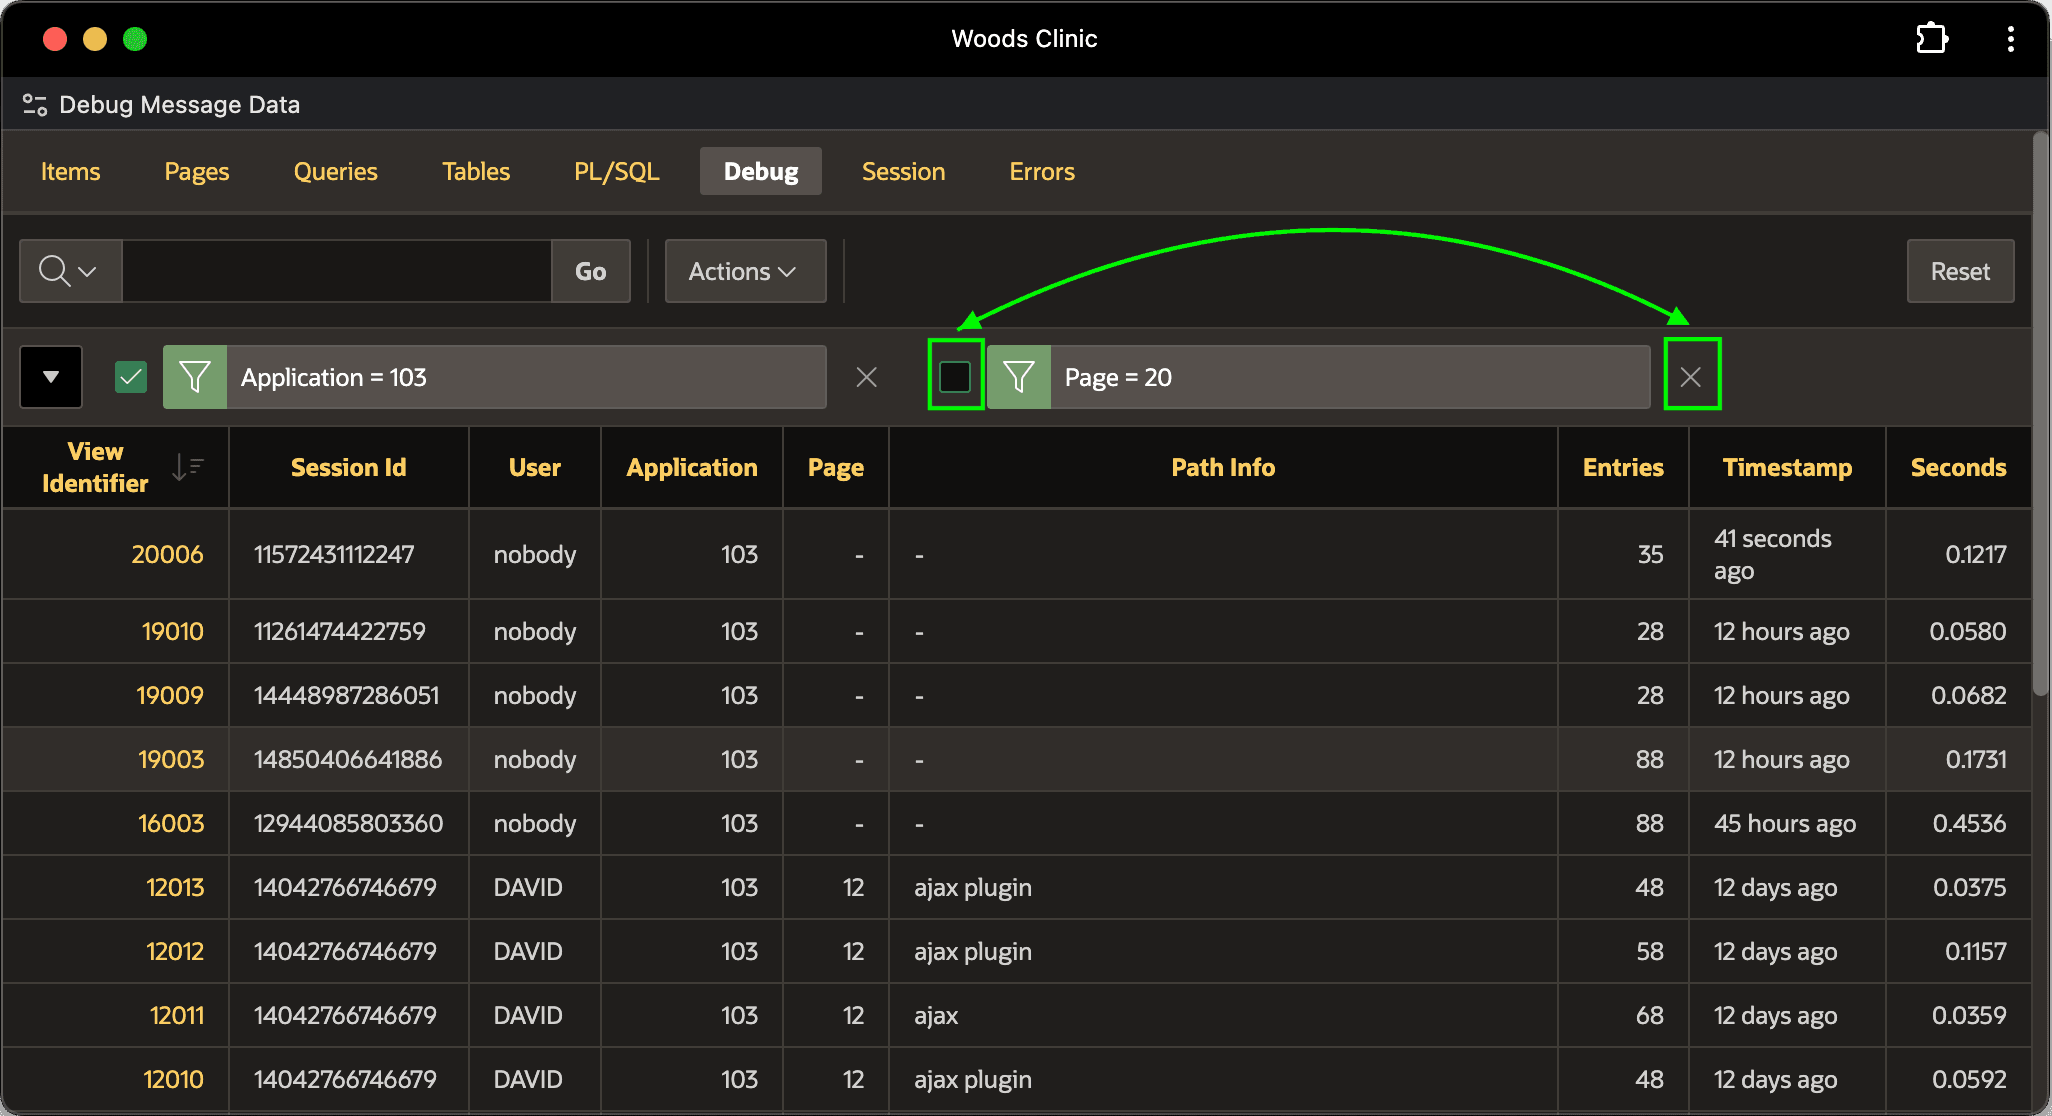
Description of the illustration debug-viewer.png
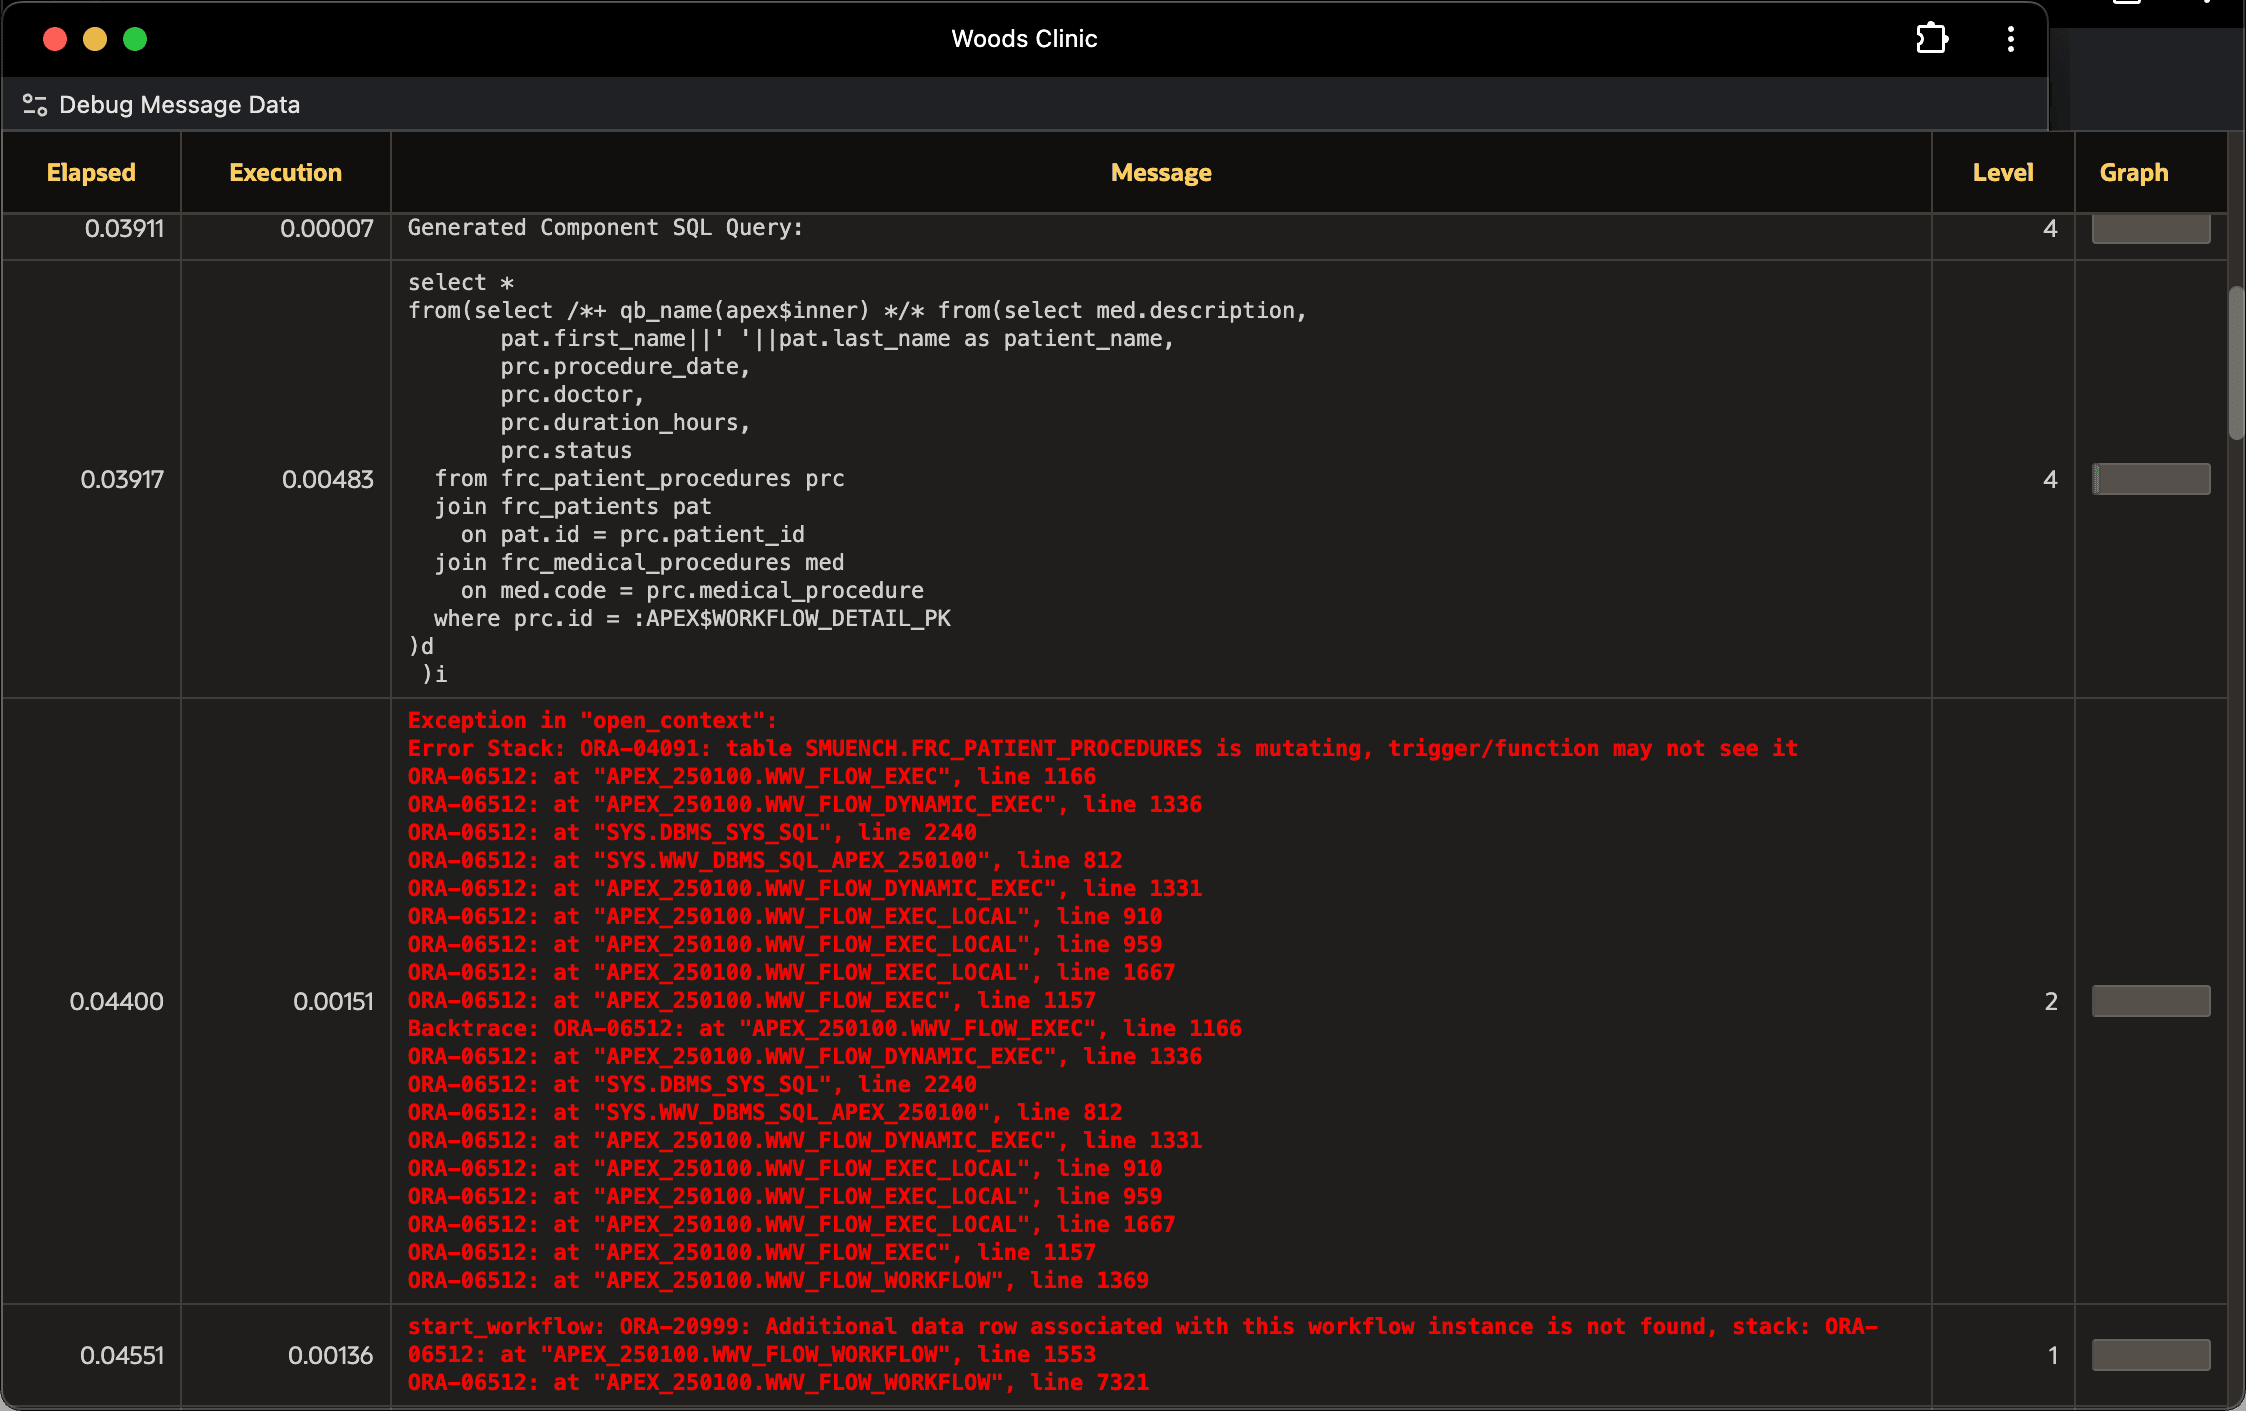
Clicking on a view identifier that occurred around the time the error happened, you can view all debug messages related to that APEX engine unit of work. As shown below, while investigating different approaches for notifying your workflow of data changes, one earlier approach attempted to start a workflow from an AFTER INSERT trigger. The call to APEX_WORKFLOW.START_WORKFLOW encountered an ORA-04091 exception while running its Additional Details query. As shown below, the debug log includes:
-
The query executing when the error occurred
-
The
ORA-04091exception with call stack -
A related mention of:
start_workflow: ORA-20999: Additional data row ... not found
The debug trace log usually includes enough information to provide clues on where the issue is happening.
Tip: The ORA-04091 error is known as a “Mutating Table” exception. It occurs when a database trigger initiates logic that queries the table that is in the process of being changed.
Description of the illustration debug-viewer-wf-callstack.png