Visualizing Workflow Progress
Show a workflow instance’s progress in a Workflow Diagram region.
In the Woods Clinic app, you can use a Workflow Diagram region in a page to visualize the progress of a particular instance. For example, imagine your end users asked to quickly understand where each recent inquiry was in the onboarding process. As shown below, you can add an link icon to your Recent Patient Inquiries page to pass the workflow instance ID to a modal page containing a Workflow Diagram region.
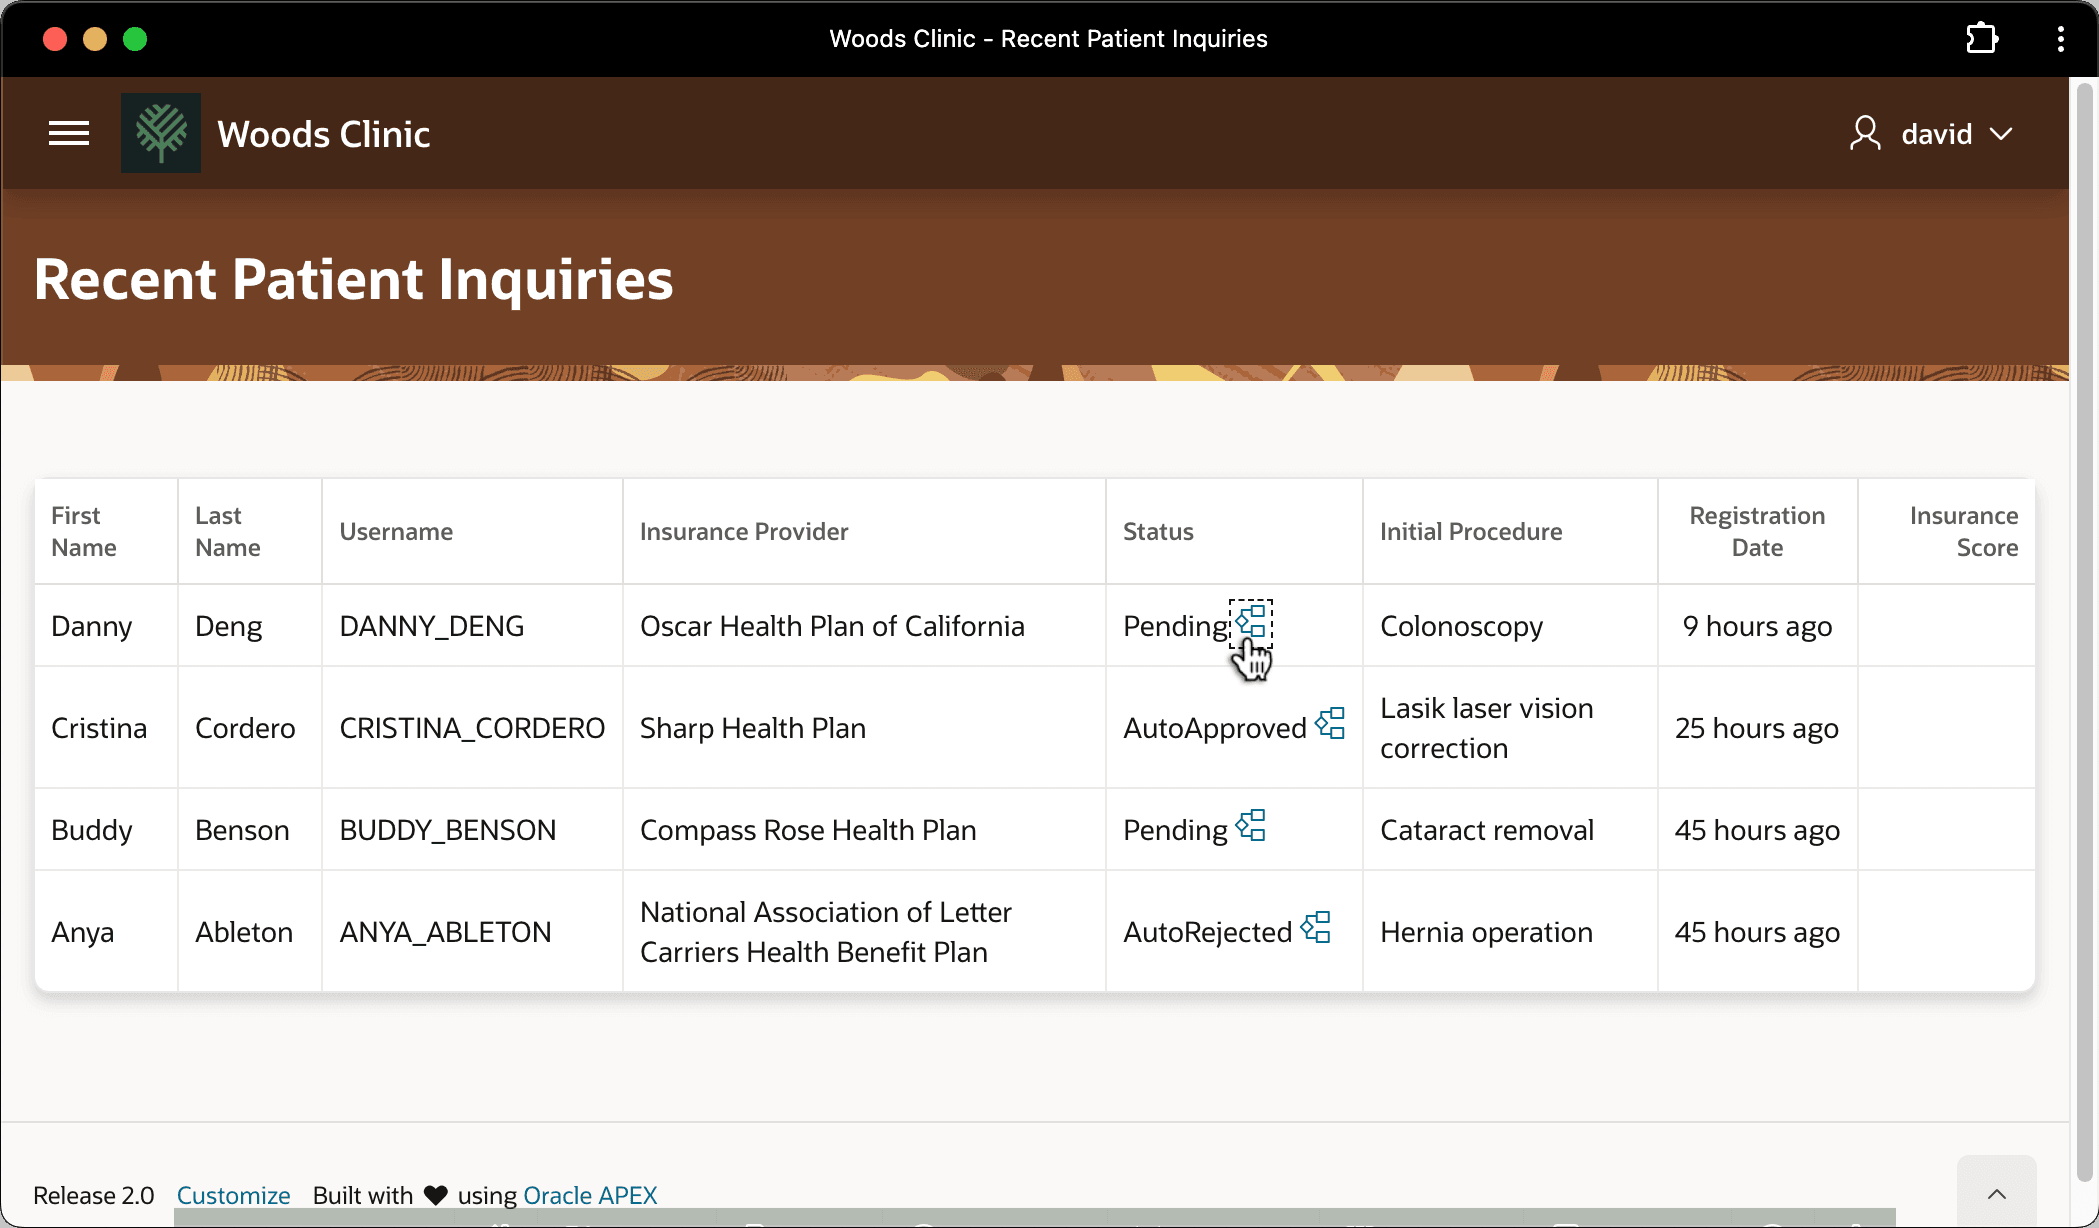
Description of the illustration workflow-woods-onboarding-recents.png
Given the workflow instance ID value, the Workflow Diagram region displays its progress as shown below. A colored outline highlights the activities and connections Danny Deng’s onboarding journey has taken so far. At a glance, it’s easy to see that:
-
his home address was within the clinic’s service range
-
his insurance company had a reasonably low risk of refusing to pay, and
-
his procedure request didn’t qualify to be auto-approved.
So it’s clear that Danny Deng’s procedure request currently awaits manual approval by back-office staff
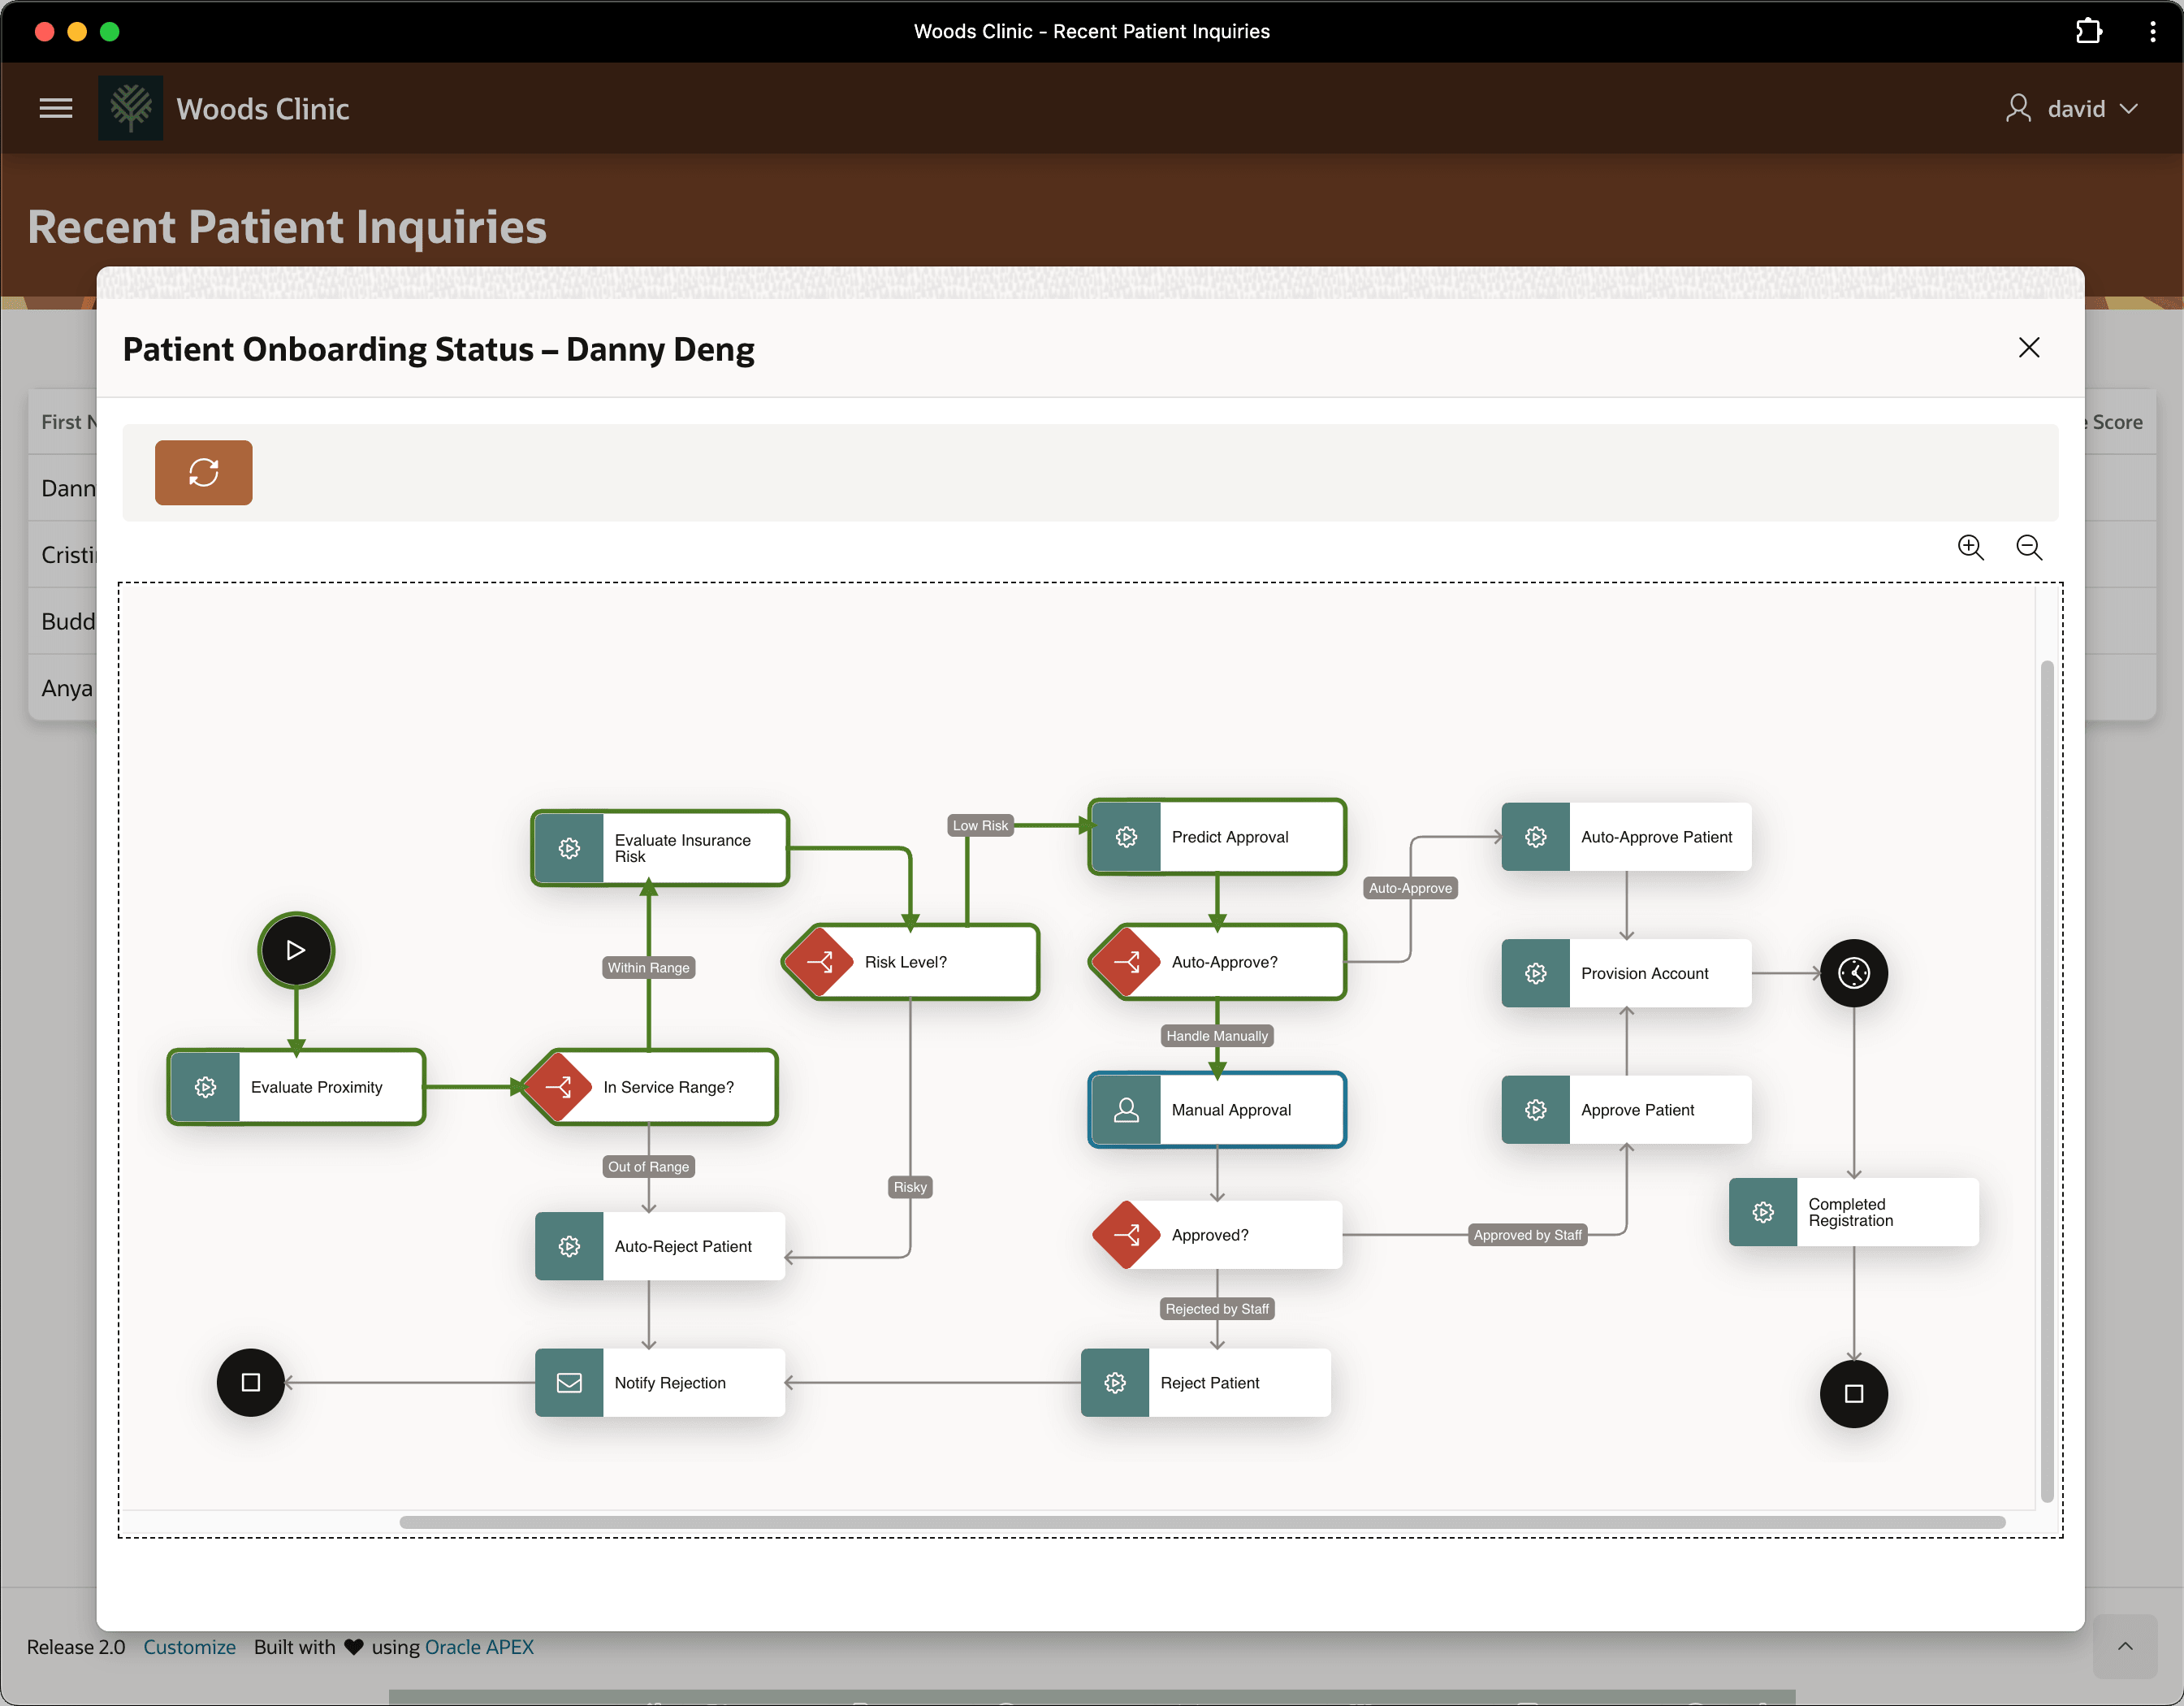
Description of the illustration workflow-woods-onboarding-rtdiagram.png