9.6 Runtime Developer Toolbar
Use the Developer toolbar to quickly edit the current application or currently running page, or view session state.
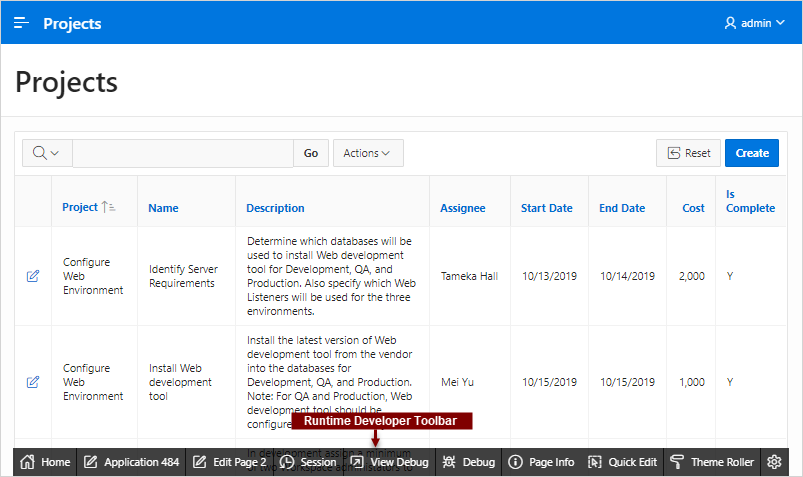
When you run a application from App Builder and view a page, the Runtime Developer toolbar displays at the bottom of any editable running page.
Tip:
The Runtime Developer toolbar only displays if the Availability, Status attribute on the Application Definition page is set to Available with Developer Toolbar
Note:
The Runtime Developer toolbar does not display on locked packaged applications pages or on desupported jQuery Mobile Smartphone pages.
The Runtime Developer toolbar contains of the following controls:
-
Home links to the Workspace home page. See "Understanding the Workspace Home Page."
-
Application links to the Application home page. See "Understanding the App Builder Home Page."
-
Edit Page displays the currently running page ID. Click the page ID to view the page in Page Designer and then edit the page.
-
Session links you to session state information for the current page. See "Viewing Session State."
-
View Debug displays the Debug reports. See "Viewing Session State."
-
Debug toggles the page between Debug and No Debug mode. See "Utilizing Debug Mode."
-
Page Info:
-
Show Layout Columns toggles between Show Layout Columns and Hide Layout Columns. This option only applies if a layout is used and that layout supports showing layout columns and the page has more than one column.
-
Show Page Timing displays the Page Performance Timing dialog. Click Copy to copy the data in table form and then paste it into another application. Click Clear to remove the current timing events.
-
-
Quick Edit enables developers to enter either Quick Edit mode or access Live Template Options.
-
Access Quick Edit Mode - Click Quick Edit and then select the desired component to instantly access the component in Page Designer. Press
ESCAPEor click outside a component to exit quick edit mode. -
Edit Live Template Options - Click Quick Edit and then move the mouse over the component for which you want to modify template options and click the Wrench icon in the upper right corner. See "Using Quick Edit to Modify Live Template Options."
-
-
Theme Roller enables developers to easily customize the appearance of an application by selecting colors from color picker and setting values. Only displays for themes supporting Theme Roller. See "Using Theme Styles and Theme Roller."
-
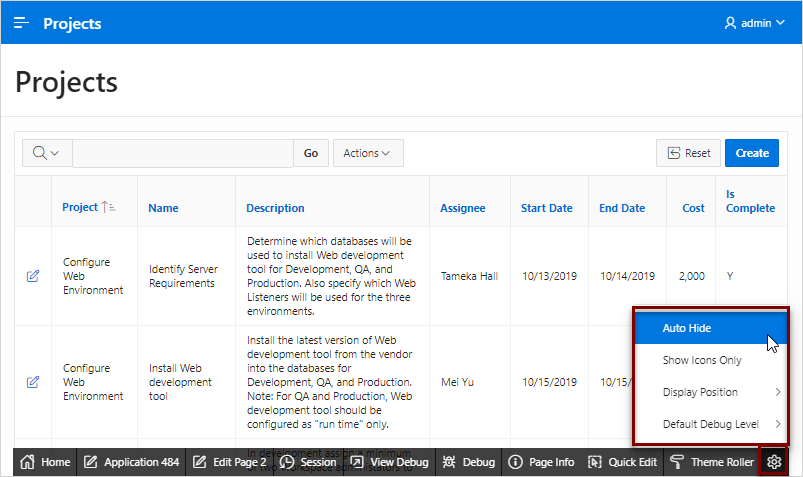
Developer Toolbar Options displays on the far right and resembles a mechanical gear. Click Developer Toolbar Options to control how the Runtime Developer Toolbar displays.
About Developer Toolbar Options
Clicking Developer Toolbar Options displays a submenu containing the following controls:
-
Auto Hide - Hides the toolbar, making more of the page visible.
-
Show Icons Only - Removes the labels from the buttons to make the toolbar smaller.
-
Display Position - Controls the placement of the Developer toolbar. Options include: Top, Left, Bottom, or Right.
-
Default Debug Level - Specifies the level of detail included in the Debug log when you click Debug.
- Info (default) - The debug log
contains the default or normal amount of information. This corresponds
with a log level of 4 and a Debug URL argument of
YES. -
App Trace - The debug log contains messages up to level 6. This corresponds with a Debug URL argument of
LEVEL6. -
Full Trace - The log will contain the maximum amount of information. This corresponds with a Debug URL argument of
LEVEL9. Full Trace can slow request processing but provides the most amount of detail.
- Info (default) - The debug log
contains the default or normal amount of information. This corresponds
with a log level of 4 and a Debug URL argument of
About JavaScript Error Detection
If a page has one or more JavaScript errors, a red error button displays on the left side of the Runtime Developer toolbar. If you have enabled Auto Hide, the Runtime Developer toolbar displays indicating the error.
Click the red error button to view an alert dialog which explains you should view the Browser console. The red error button persists until error has been resolved, the Browser console is cleared, and you refresh the page.
See Also:
Parent topic: Editing Pages in Page Designer

