14.3.2.12.1 Getting Started with the RDF View Wizard
- Navigate to the Data page.
- Select the Data source and RDF network.
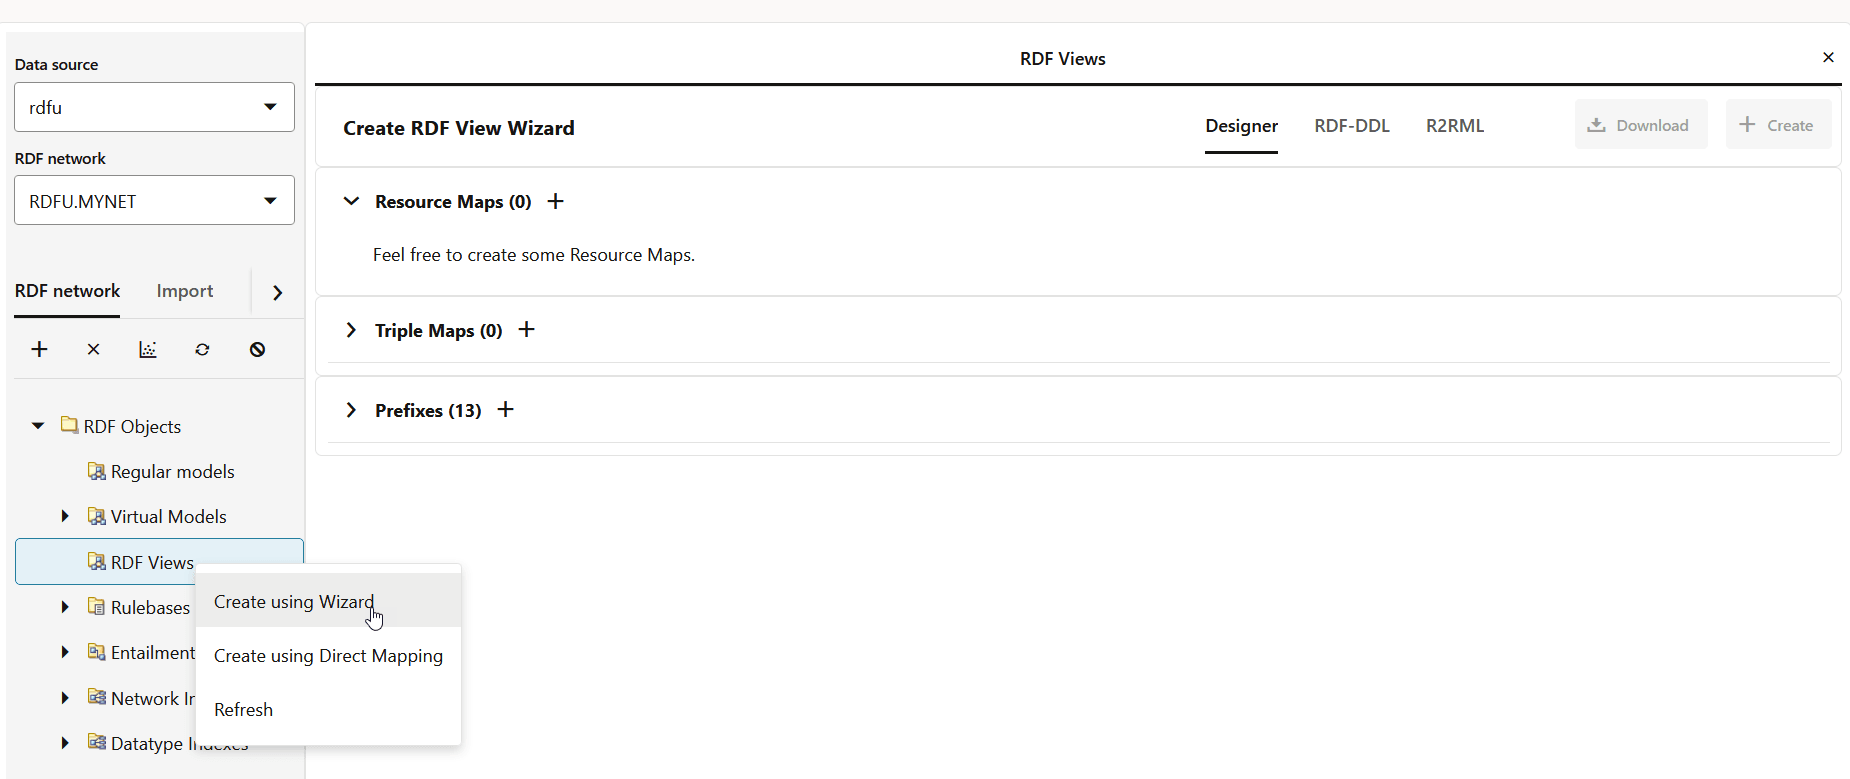
- Right click RDF Views under RDF Objects in the RDF Network tab.
- Click Create using Wizard from the context menu.The Create RDF View Wizard page opens on the right panel as shown:
- Create the Resource Maps (nodes) for the RDF view graph
in the Designer tab.
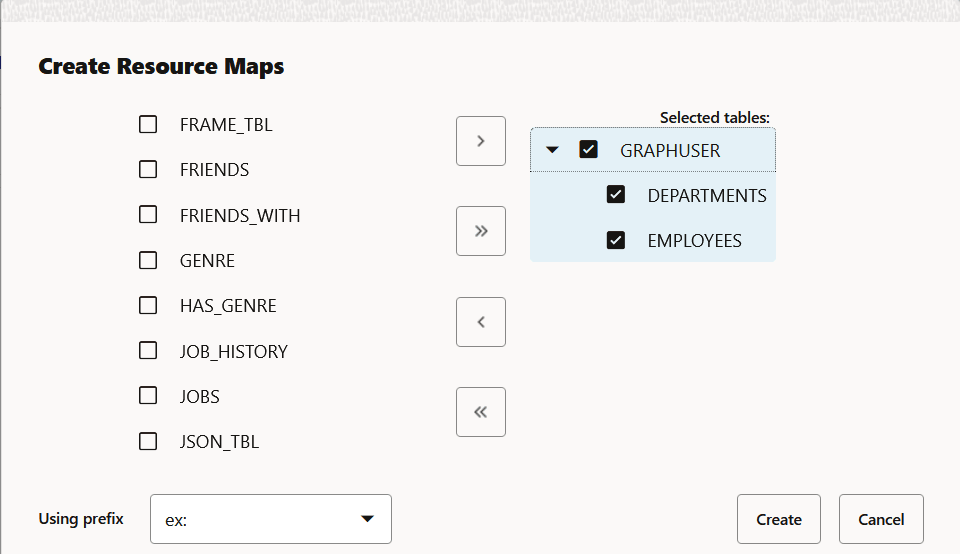
- Click the Add new Resource Map (+) icon. The Create Resource Maps dialog opens.
- Select the required input tables and move the selection to the right.
- Select a prefix value from the Using prefix drop-down.
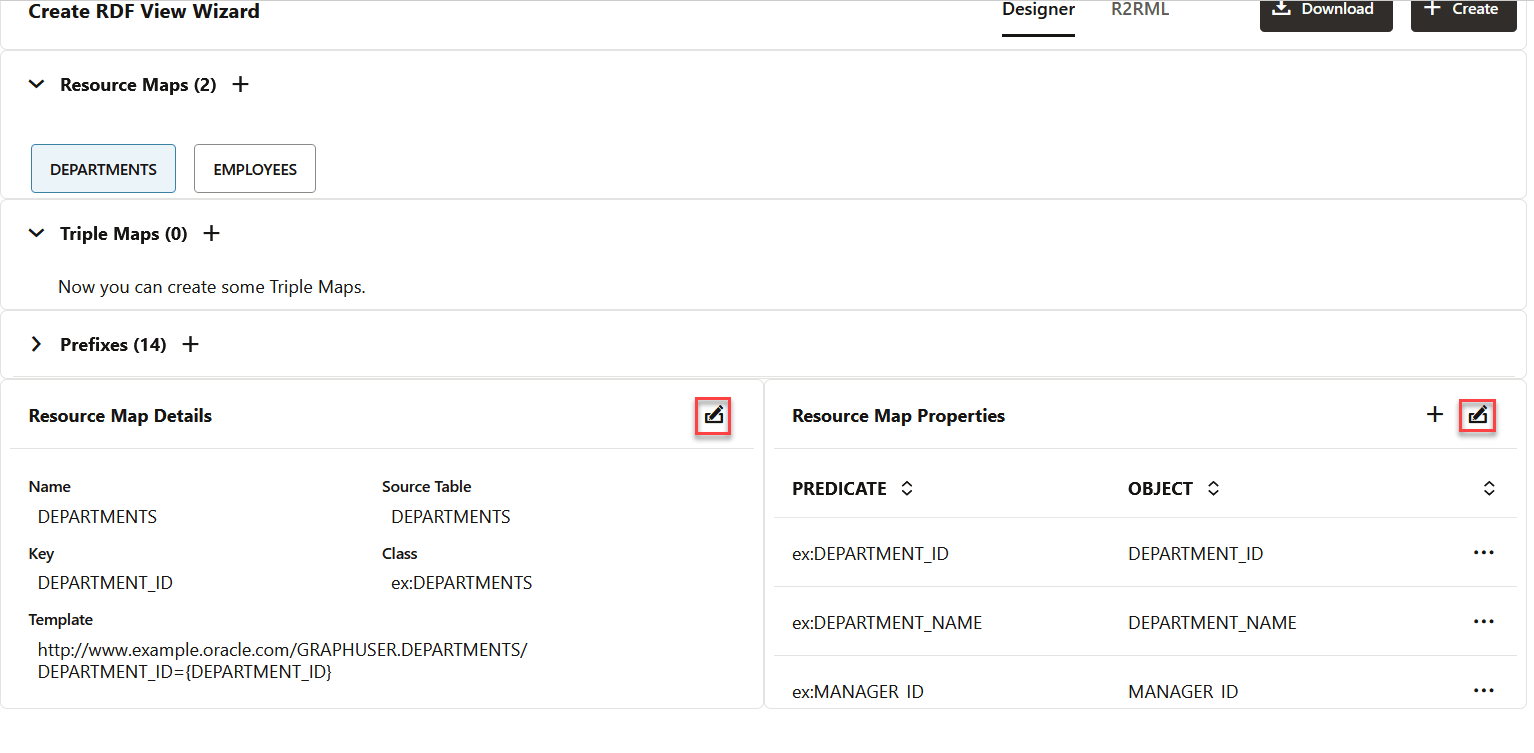
- Click Create.The selected tables are added and displayed in the Resource Maps section.
You can click on a specific resource map to view the details as shown:
Also, note the following:
- If the underlying database table for the resource map does not have a primary key, then the first table column will be considered as the resource map Key by default.
- You can choose to edit the key, class, and template (subject) of the resource map in the Resource Map Details section.
- You can choose to edit the mapping for the predicate and object of the properties in the Resource Map Properties section.
- Click the Add new Resource Map (+) icon.
- Create the Triple Maps (edges) for the RDF view graph in
the Designer tab.
- Click the Triple Map (+) icon.The Create Triple Map workflow opens and the Name step is displayed.
- Enter the Triple Map name.
- Click the Next arrow icon.The Select step opens as shown.
- Select the Relationship table from the drop-down.
- Click the Next arrow icon.The Define step opens displaying the Source tab.
- Select the source References RMAP and Key in the Source tab.
- Select the Prefix and Suffix values in the Edge tab.
- Select the destination References RMAP and Key in the Target tab.
- Click the Next arrow icon.The Summary of the designed graph structure is displayed. For example:
- Click Create.The configured triple is added and displayed in the Triple Maps section.
- Optionally, repeat step-6 to add as many triple maps as required.You can click on a specific triple map to view or edit the details as shown:
- Click the Triple Map (+) icon.
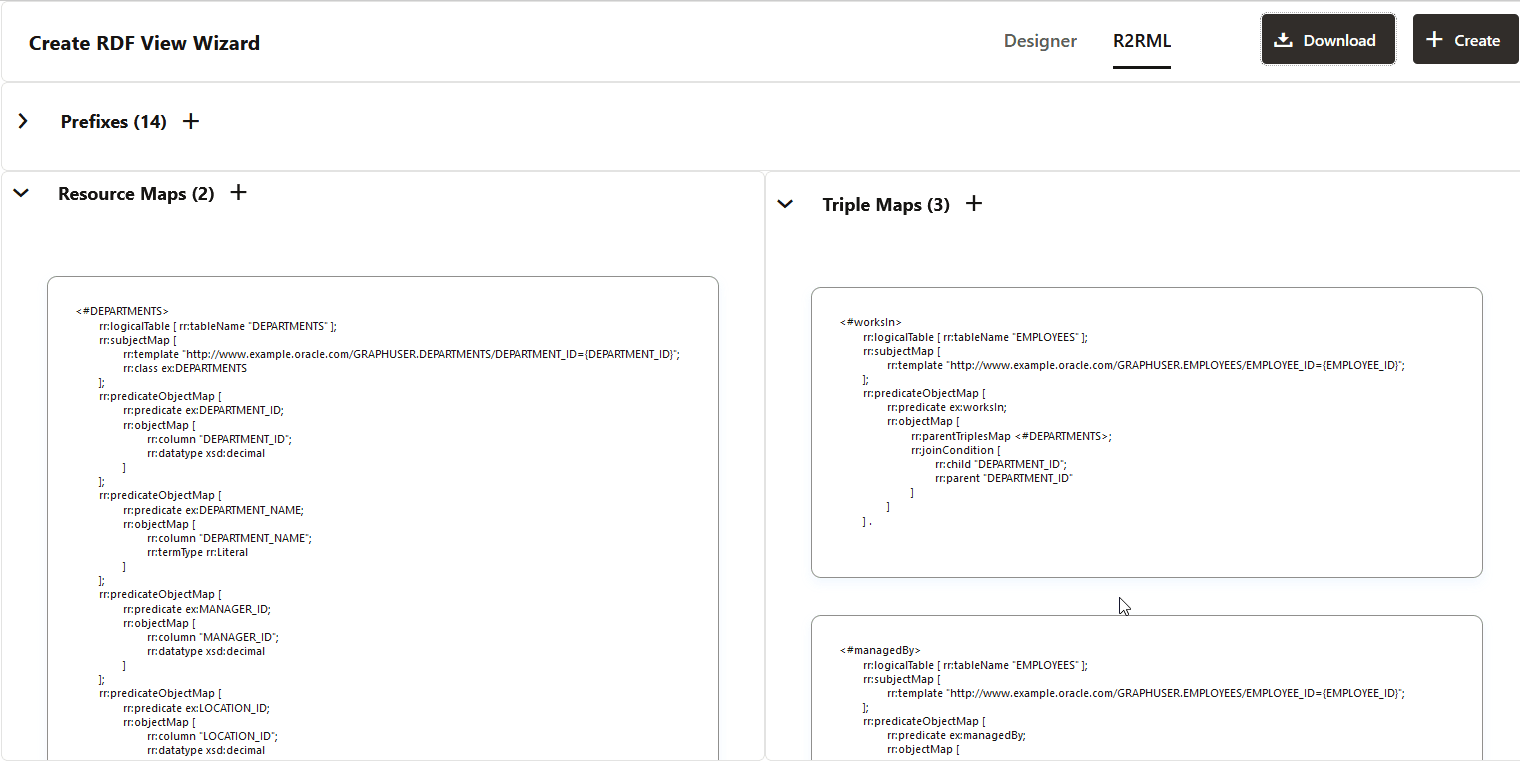
- Optionally, review and click Download to download the
mapping details in the R2RML tab.
- Click Create (Create RDF View button) on the top
right of the Create RDF View Wizard page.The Create RDF View window opens as shown:
- Enter RDF View name and click Create.
- Refresh RDF Views in the left pane under RDF
Objects.The newly created view is successfully added to the list.
Optionally, you can right click on an RDF view graph and click Open to view the RDF view graph details. You can execute SPARQL queries in the SPARQL tab. The results of the SPARQL query can be viewed either as a tabular output, graph, or both.
Figure 14-71 Executing SPARQL Queries on an RDF View
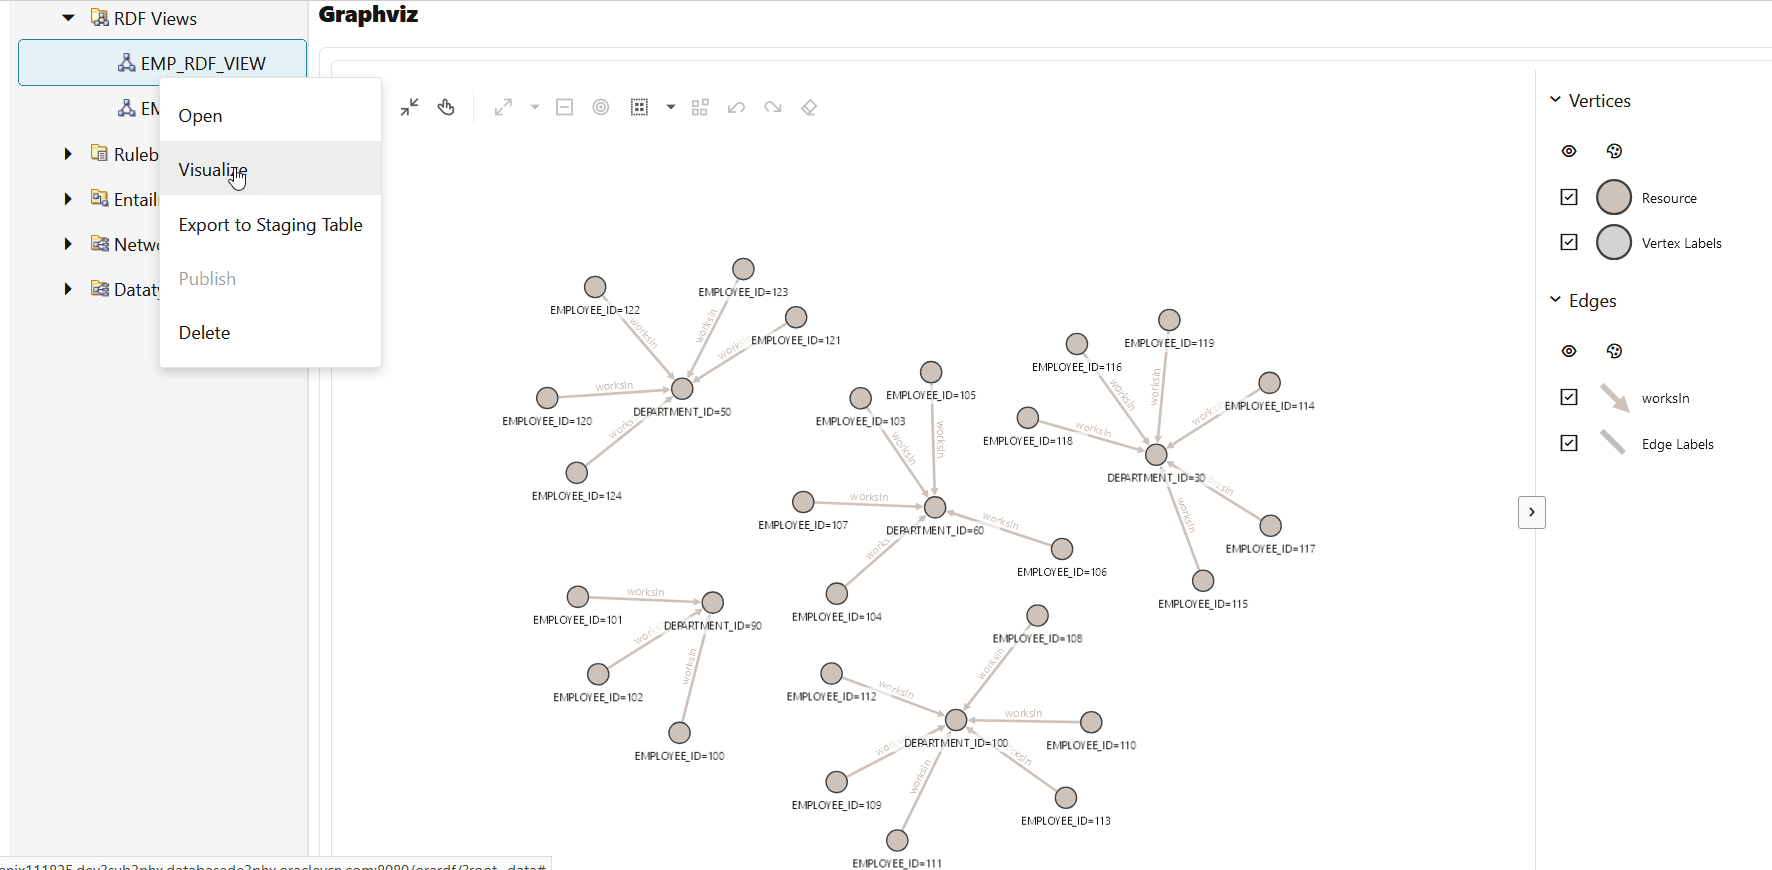
You can also right click on an RDF view graph and select Visualize. This opens the RDF view visualization page in a new tab. You can enter a SPARQL query in the Query selector section and click Execute. The output of the query is displayed as a graph in the Graphviz section. For example, consider running the following SPARQL query to find the department in which the employees work:
PREFIX ex: <http://www.example.oracle.com/>
construct { ?s ex:worksIn ?o }
where {
  ?s ex:worksIn ?o
}
LIMIT 25
The query visualization output gets displayed as shown:
Figure 14-72 Visualizing SPARQL Queries on an RDF View Graph
Parent topic: RDF Views from Relational Data
