4.4 Using Cluster Health Monitor from Enterprise Manager Cloud Control
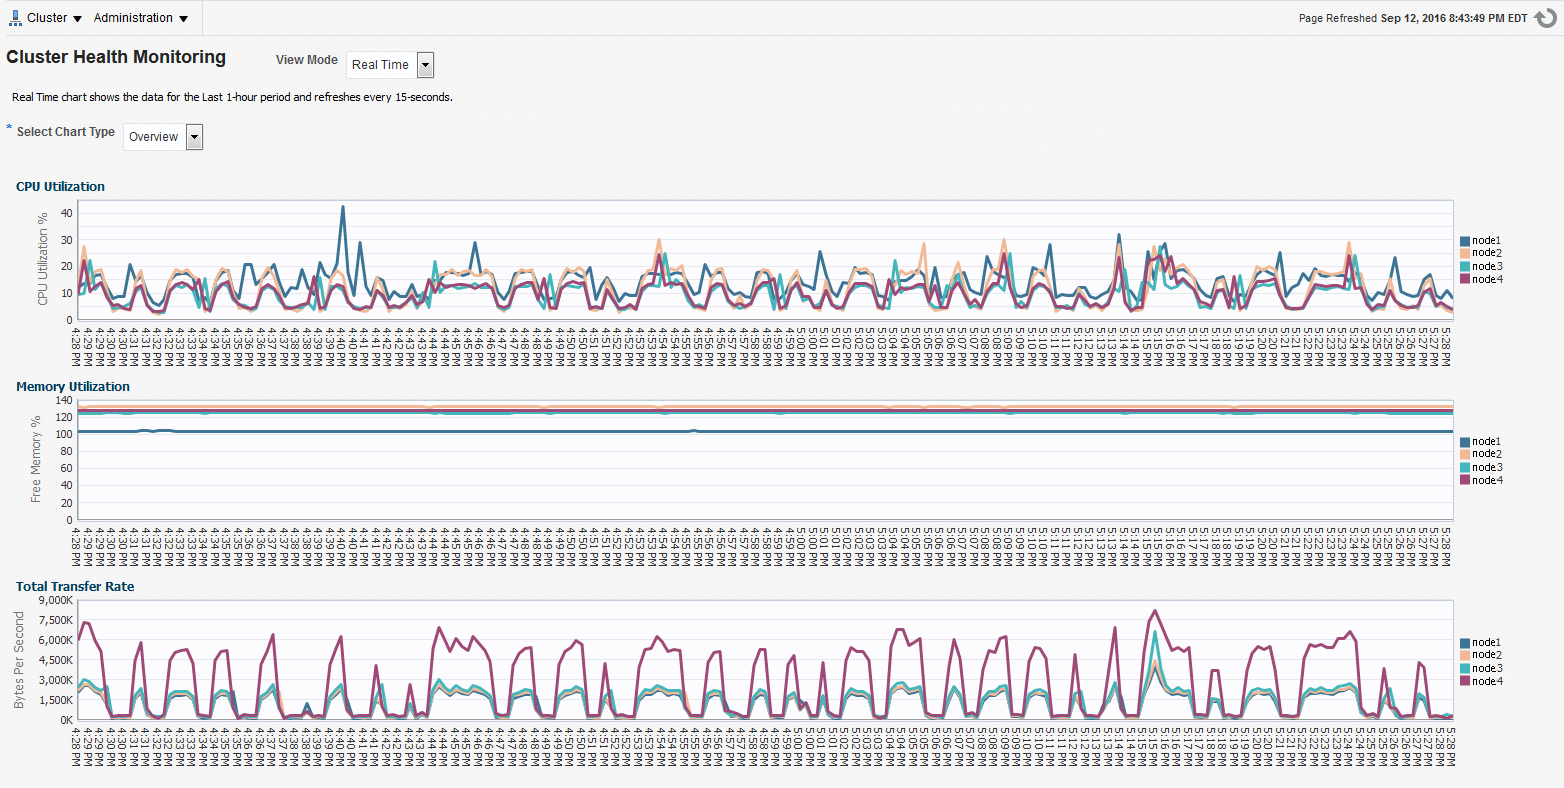
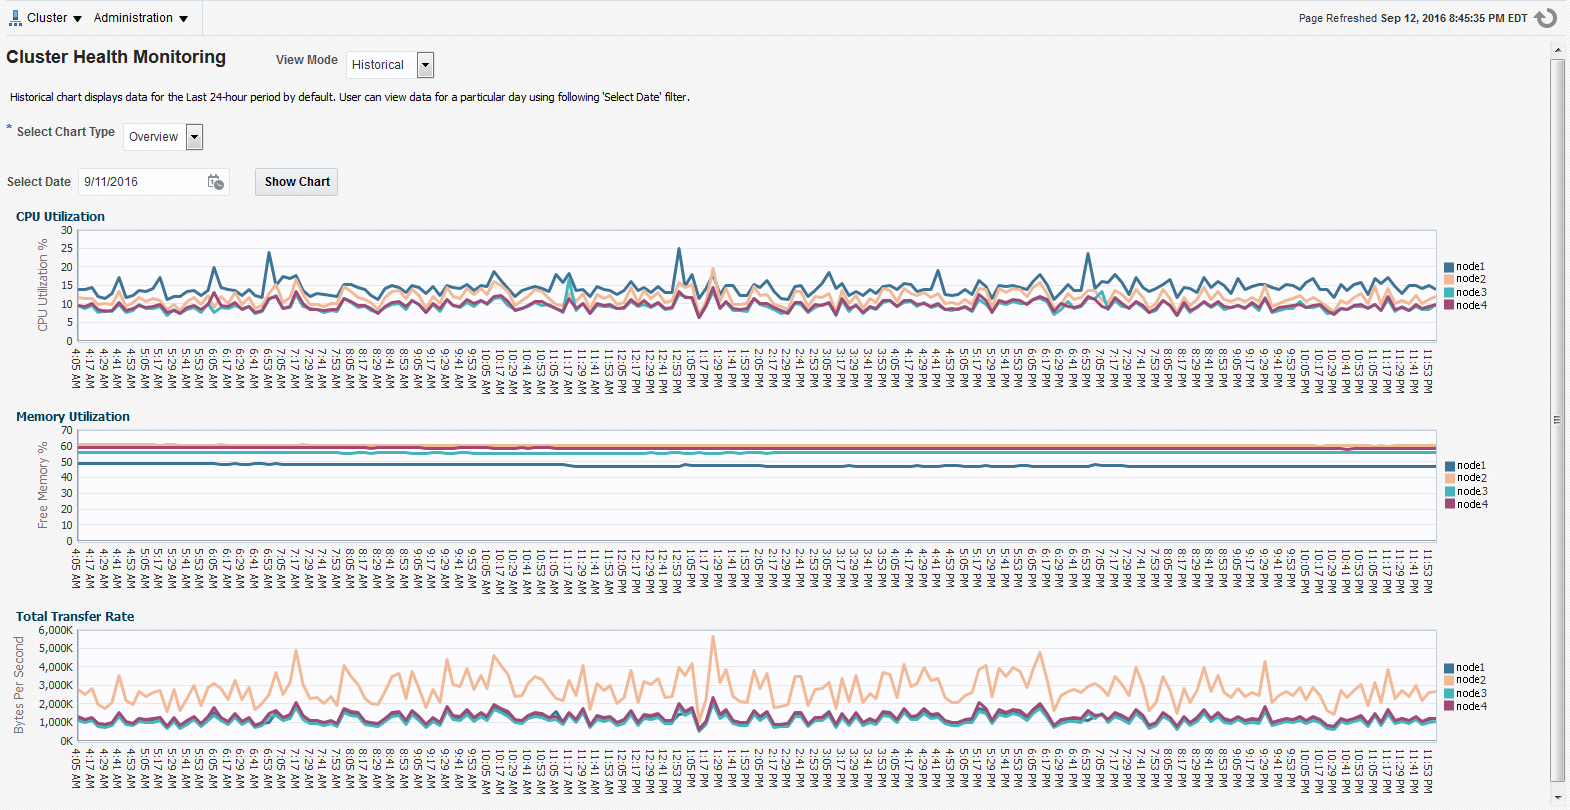
Histograms presented in real-time and historical modes enable you to understand precisely what was happening at the time of degradation or failure.
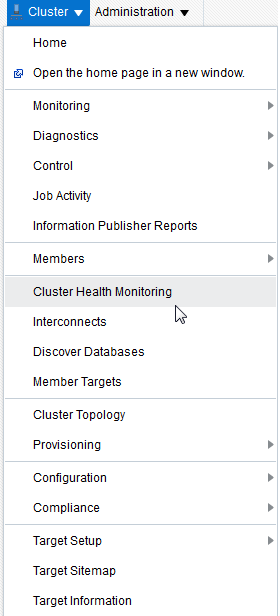
The metric data from Cluster Health Monitor is available in graphical display within Enterprise Manager Cloud Control. Complete cluster views of this data are accessible from the cluster target page. Selecting the Cluster Health Monitoring menu item from the Cluster menu presents a log-in screen prompting for the Cluster Health Monitor credentials. There is a fixed EMUSER and the password is user-specified. Once the credentials are saved, you then can view Cluster Health Monitor data for the last day in overview format for the entire cluster. Metric categories are CPU, Memory, and Network.
Each category is able to be separately display in greater detail showing more metrics. For example, selecting CPU results in cluster graphs detailing CPU System Usage, CPU User Usage, and CPU Queue Length. From any cluster view, you can select individual node views to more closely examine performance of a single server. As in the case of CPU, the performance of each core is displayed. Move your cursor along the graph to see a tool-tip displaying the numerical values and time stamp of that point.
Besides examining the performance of the current day, you can also review historical data. The amount of historical data is governed by the retention time configured in the Cluster Health Monitor repository in the Gird Infrastructure Management Repository and defaults to 72 hours. This view is selectable at any time by using the View Mode drop-down menu and selecting Historical. A previous date can then be entered or selected from a pop-up calendar that has dates where data is available bolded. Selecting Show Chart then displays the associated metrics graphs.
To view Cluster Health Monitor data:
Parent topic: Collecting Operating System Resources Metrics


