Comparing a Baseline to Another Baseline or Pair of Snapshots

When performance degradation occurs over time, you can run the AWR Compare Periods report to compare the degraded performance, captured as a new baseline or a pair of snapshots, to an existing baseline. You must have a baseline that represents the system operating at an optimal level. If an existing baseline is unavailable, then compare database performance between two periods of time using two arbitrary pairs of snapshots, as described in "Comparing Two Pairs of Snapshots".

To compare a baseline to another baseline:

  1. Access the Database Home page for the target database.

    See "Accessing the Database Home Page" for more information.

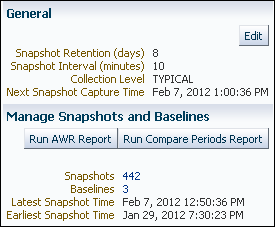
  2. From the Performance menu, select AWR, then AWR Administration.

    If the Database Login page appears, then log in as a user with administrator privileges. The Automatic Workload Repository page appears.

  3. Under Manage Snapshots and Baselines, click the link next to Baselines.

    The AWR Baselines page appears.

  4. Complete the following steps:
    1. Select the baseline to use for the report.

      At least one existing baseline must be available.

    2. From the Actions list, select Compare Periods and then click Go.

    The Compare Periods: Second Period Start page appears. Under First Period, the selected baseline is displayed.

    In this example, the baseline named BASELINE_TUE_1120 is selected.

  5. Compare the baseline selected in the first period to another baseline or a pair of snapshots. Do one of the following:
    • To compare to another baseline, select Select a Baseline and the baseline you want to use in the second period, and then click Next.

      The Compare Periods: Review page appears.

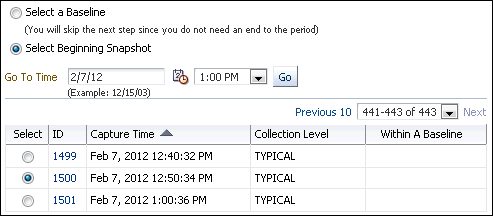
    • To compare to a pair of snapshots, select Select Beginning Snapshot and the beginning snapshot to use in the second period, and then click Next.

      This example selects snapshot 18, taken on February 7, 2012 at 1:00 p.m.

      The Compare Periods: Second Period End appears. Proceed to the next step.

  6. Select the ending snapshot for the snapshot period to include in the report and then click Next.

    In this example, snapshot 1500, taken on February 7, 2009 at 12:50 p.m., is selected.

    The Compare Periods: Review page appears.

  7. Review the periods to be included in the report and then click Finish.

    The Compare Periods: Results page appears.

    Data from the selected periods appears under the General subpage. You can view data per second or per transaction by selecting an option from the View Data list.

    Note:

    If the time periods have different lengths, then the data is normalized over database time before calculating the difference so that periods of different lengths can be compared.

    In this example, almost every metric shows that more resources were consumed in the first period. The bar graphs indicate the proportions of the values in the two periods. The absence of bars indicates equivalent values. The report for this example shows significantly more database block changes per second and parse time in the first period than in the second.

  8. Click Report to view the report.

    The Processing: View Report page appears while the report is being generated. After it completes, the report appears.

  9. Optionally, do the following:
    • To change periods, click Change Periods.

    • To save the report as an HTML file, click Save to File.