Load Profile
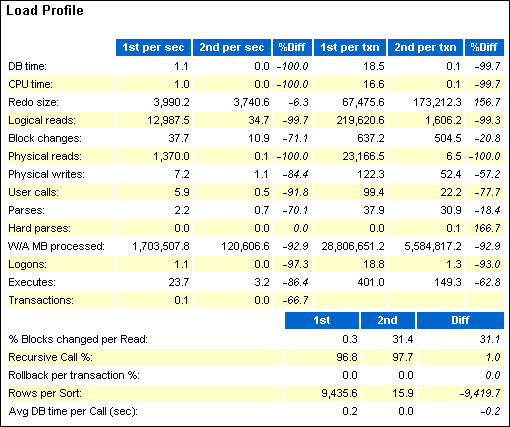
The Load Profile section compares the loads used in the two snapshot sets. Differences in the loads are quantified as percentages in the %Diff column.
In this example, the DB time per second was 100% higher in the first period. CPU time per second was 100% higher.
