 Monitor
Database Performance Using Enterprise Manager Database Express
Monitor
Database Performance Using Enterprise Manager Database Express Before You Begin
This 20-minute tutorial shows you how to monitor your database using Oracle Enterprise Manager Database Express.
Select the Oracle Database release:
Background
This tutorial shows you how to perform some of the monitoring operations using Enterprise Manager Database Express.
What Do You Need?
- Oracle Database 18c19c
 Use
Performance Hub
Use
Performance Hub
This is an unnumbered paragraph before a procedure.
- Launch Enterprise Manager Database Express. Login as the SYSTEM user.

Description of the illustration a1 - Select Performance Hub from the Performance menu.
- Real Time data collected in the last hour is displayed. Click Select Time Period to view the other options available.
- In the Select Time Period window, click the drop-down menu
and select Real Time - Last
Hour. Click OK.

Description of the illustration a4 - You will see a time window slider in the Time Picker area.
Use the handles on the left and right edges of the window to
pull the window over to an interesting time period of
activity.

Description of the illustration a5 - Click the Activity tab.
The Activity tab provides details about the activity that
happened during the selected time window.

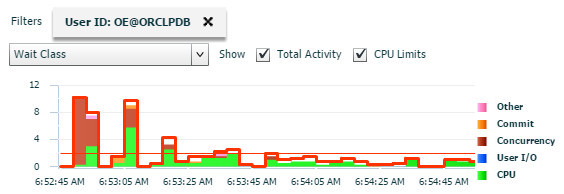
Description of the illustration a6 - Click the Wait Class drop-down
menu.In the Wait Class menu, click Session
Identifiers and select User
ID to see the user IDs responsible for the workload.

Description of the illustration a7 - Place the mouse cursor on the largest area in the graph. It will turn the largest User ID workload to a highlighted yellow. Click to make this User ID as the filter condition.
- You will see the selected User ID’s workload during the time
window period. Other workloads will not be shown and will
appear as blank space in the graphs. This allows you to focus
on a single user. In this case, most of the wait class for the
selected user is Concurrency and CPU.
Description of the illustration a9 - Once again, click the Wait
Class drop-down arrow. Select Top
Dimensions and then Module
to isolate the modules the user was running.

Description of the illustration a10 - The modules the user was running are listed on the right, in the graph’s legend. Click the module with the largest area represented in the graph.
- Module now becomes a 2nd filter condition and it shows that
the module waited mostly on Concurrency and CPU.

Description of the illustration 12 - Click both X’s to
remove the filter conditions. Click the
Workload tab.

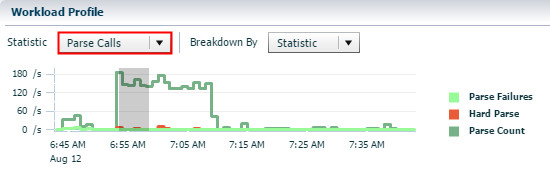
Description of the illustration a13 - The Workload tab has Workload Profile, Sessions, and Top SQL sections. In the Workload Profile section, click the Statistic drop-down and select Parse Calls to see graphically how parse calls behaved during the time window.
- You see Parse Failures, Hard Parse, and Parse Count.
Description of the illustration a15 - Select Redo Size from
the Statistic drop-down. You see redo activity during, before,
and after the time window.

Description of the illustration a16 - In the Sessions
section, select Open Cursors
from the Statistic drop-down to see cursor activity.

Description of the illustration a17 - In the Top SQL section, you see the SQL IDs ranked from most
to least activity. Click the SQL
ID with the most activity.

Description of the illustration a18 Note: You may receive a different output when you perform this tutorial.
- You can examine particulars about that SQL, including
Database Time, IO Bytes and Buffer Gets. Now click the Activity tab again.

Description of the illustrationa19 - The context of the tabs is now centered on that specific SQL
ID. You see that the SQL ID is now a filter condition, but
this filter cannot be deleted because all the tabs now
describe activity for that specific SQL ID. Wait Class is the
default activity displayed for this SQL ID.

Description of the illustration a20 - To see the user, click the Wait Class down-down arrow. Click Session Identifiers and then select User ID.
- You see details for this user's SQL ID in the Activity and the time window graph. Activity for this specific SQL ID is highlighted. Activity not related to this SQL ID is the blank area under the curves.
- Click ORCL to return to the database home page.