4.9 Graph Schema Visualization
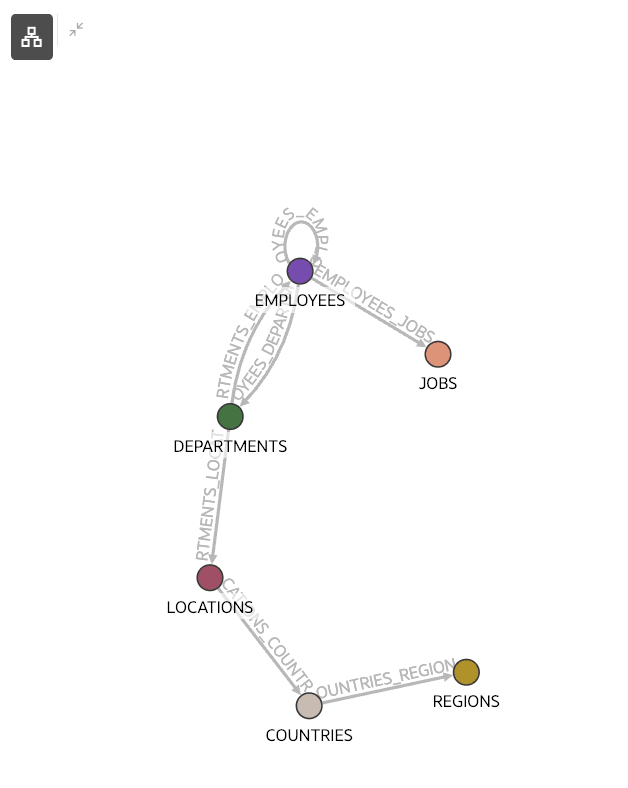
You can visualize the underlying database schema for your property graph using the Graph Visualization library.
The following shows an example JSON configuration for a schema view:
{
  "vertices": [
    {
      "labels": ["COUNTRIES"],
      "properties": [
        {
          "name": "REGION_ID",
          "dataType": "number",
          "limits": [],
          "mandatory": false
        },
        {
          "name": "COUNTRY_ID",
          "dataType": "string",
          "limits": [2],
          "mandatory": true
        },
        {
          "name": "COUNTRY_NAME",
          "dataType": "string",
          "limits": [40],
          "mandatory": false
        }
      ]
    },
    {
      "labels": ["DEPARTMENTS"],
      "properties": [
        {
          "name": "MANAGER_ID",
          "dataType": "number",
          "limits": [],
          "mandatory": false
        },
        {
          "name": "LOCATION_ID",
          "dataType": "number",
          "limits": [],
          "mandatory": false
        },
        {
          "name": "DEPARTMENT_ID",
          "dataType": "number",
          "limits": [],
          "mandatory": true
        },
        {
          "name": "DEPARTMENT_NAME",
          "dataType": "string",
          "limits": [30],
          "mandatory": true
        }
      ]
    },
    {
      "labels": ["LOCATIONS"],
      "properties": [
        {
          "name": "CITY",
          "dataType": "string",
          "limits": [30],
          "mandatory": true
        },
        {
          "name": "COUNTRY_ID",
          "dataType": "string",
          "limits": [2],
          "mandatory": false
        },
        {
          "name": "LOCATION_ID",
          "dataType": "number",
          "limits": [],
          "mandatory": true
        },
        {
          "name": "POSTAL_CODE",
          "dataType": "string",
          "limits": [12],
          "mandatory": false
        },
        {
          "name": "STATE_PROVINCE",
          "dataType": "string",
          "limits": [25],
          "mandatory": false
        },
        {
          "name": "STREET_ADDRESS",
          "dataType": "string",
          "limits": [40],
          "mandatory": false
        }
      ]
    },
    {
      "labels": ["JOBS"],
      "properties": [
        {
          "name": "JOB_ID",
          "dataType": "string",
          "limits": [10],
          "mandatory": true
        },
        {
          "name": "JOB_TITLE",
          "dataType": "string",
          "limits": [35],
          "mandatory": true
        },
        {
          "name": "MAX_SALARY",
          "dataType": "number",
          "limits": [],
          "mandatory": false
        },
        {
          "name": "MIN_SALARY",
          "dataType": "number",
          "limits": [],
          "mandatory": false
        }
      ]
    },
    {
      "labels": ["EMPLOYEES"],
      "properties": [
        {
          "name": "EMAIL",
          "dataType": "string",
          "limits": [25],
          "mandatory": true
        },
        {
          "name": "JOB_ID",
          "dataType": "string",
          "limits": [10],
          "mandatory": true
        },
        {
          "name": "SALARY",
          "dataType": "number",
          "limits": [],
          "mandatory": false
        },
        {
          "name": "HIRE_DATE",
          "dataType": "string",
          "limits": [],
          "mandatory": true
        },
        {
          "name": "LAST_NAME",
          "dataType": "string",
          "limits": [25],
          "mandatory": true
        },
        {
          "name": "FIRST_NAME",
          "dataType": "string",
          "limits": [20],
          "mandatory": false
        },
        {
          "name": "MANAGER_ID",
          "dataType": "number",
          "limits": [],
          "mandatory": false
        },
        {
          "name": "EMPLOYEE_ID",
          "dataType": "number",
          "limits": [],
          "mandatory": true
        },
        {
          "name": "PHONE_NUMBER",
          "dataType": "string",
          "limits": [20],
          "mandatory": false
        },
        {
          "name": "DEPARTMENT_ID",
          "dataType": "number",
          "limits": [],
          "mandatory": false
        },
        {
          "name": "COMMISSION_PCT",
          "dataType": "number",
          "limits": [],
          "mandatory": false
        }
      ]
    },
    {
      "labels": ["REGIONS"],
      "properties": [
        {
          "name": "REGION_ID",
          "dataType": "number",
          "limits": [],
          "mandatory": true
        },
        {
          "name": "REGION_NAME",
          "dataType": "string",
          "limits": [25],
          "mandatory": false
        }
      ]
    }
  ],
  "edges": [
    {
      "labels": ["COUNTRIES_REGIONS"],
      "properties": [],
      "sourceVertexLabels": ["COUNTRIES"],
      "targetVertexLabels": ["REGIONS"]
    },
    {
      "labels": ["DEPARTMENTS_EMPLOYEES"],
      "properties": [],
      "sourceVertexLabels": ["DEPARTMENTS"],
      "targetVertexLabels": ["EMPLOYEES"]
    },
    {
      "labels": ["DEPARTMENTS_LOCATIONS"],
      "properties": [],
      "sourceVertexLabels": ["DEPARTMENTS"],
      "targetVertexLabels": ["LOCATIONS"]
    },
    {
      "labels": ["LOCATIONS_COUNTRIES"],
      "properties": [],
      "sourceVertexLabels": ["LOCATIONS"],
      "targetVertexLabels": ["COUNTRIES"]
    },
    {
      "labels": ["EMPLOYEES_JOBS"],
      "properties": [],
      "sourceVertexLabels": ["EMPLOYEES"],
      "targetVertexLabels": ["JOBS"]
    },
    {
      "labels": ["EMPLOYEES_DEPARTMENTS"],
      "properties": [],
      "sourceVertexLabels": ["EMPLOYEES"],
      "targetVertexLabels": ["DEPARTMENTS"]
    },
    {
      "labels": ["EMPLOYEES_EMPLOYEES"],
      "properties": [],
      "sourceVertexLabels": ["EMPLOYEES"],
      "targetVertexLabels": ["EMPLOYEES"]
    }
  ]
}
The corresponding schema visualization is as shown:
Figure 4-13 Visualizing Database Schema for the Property Graph
Parent topic: Usage Examples
