10 Getting Started with the Graph Visualization Extension for VS Code

Oracle SQL Developer Graph Visualization for VSCode enables you to visualize the results of SQL graph queries when using Oracle SQL Developer for Visual Studio Code (VS Code).

VS Code is a powerful open-source code editor supported on multiple operating systems (such as Linux, Windows, and macOS). SQL Developer for VS Code allows you to connect to your target database where you can open a SQL Worksheet to execute SQL statements and queries. The Graph Visualization extension extends the capability of the SQL Developer extension to support graph visualization when running SQL graph queries.
Before you begin using the Graph Visualization extension, ensure that you have VS Code Editor installed in your system and you are using Oracle Database 23ai. The instructions also assume that you have a SQL property graph already created in your database.
  1. Open the VS Code Editor and click open the Extensions view.
  2. Search and install Oracle SQL Developer Graph Visualization for VSCode.
    The Oracle SQL Developer Extension for VS Code gets automatically installed as a dependency. You can view the SQL Developer icon in the Activity Bar on the left. If the SQL Developer extension was already installed in your system, then the extension gets updated with the graph visualization feature.
  3. Connect to Oracle Database 23ai using the SQL Developer extension.
  4. Open a SQL Worksheet and enter a SQL graph query.
    Note that to visualize the output of a SQL graph query, the query must use the VERTEX_ID and EDGE_ID functions to return the vertex and edge IDs. For example:
    SELECT id_a, id_e, id_b
     FROM GRAPH_TABLE ( GRAPHUSER.BANK_GRAPH
      MATCH (a IS Accounts) -[e IS Transfers]-> (b IS Accounts)
      COLUMNS (vertex_id(a) AS id_a, edge_id(e) AS id_e, vertex_id(b) AS id_b )
    )
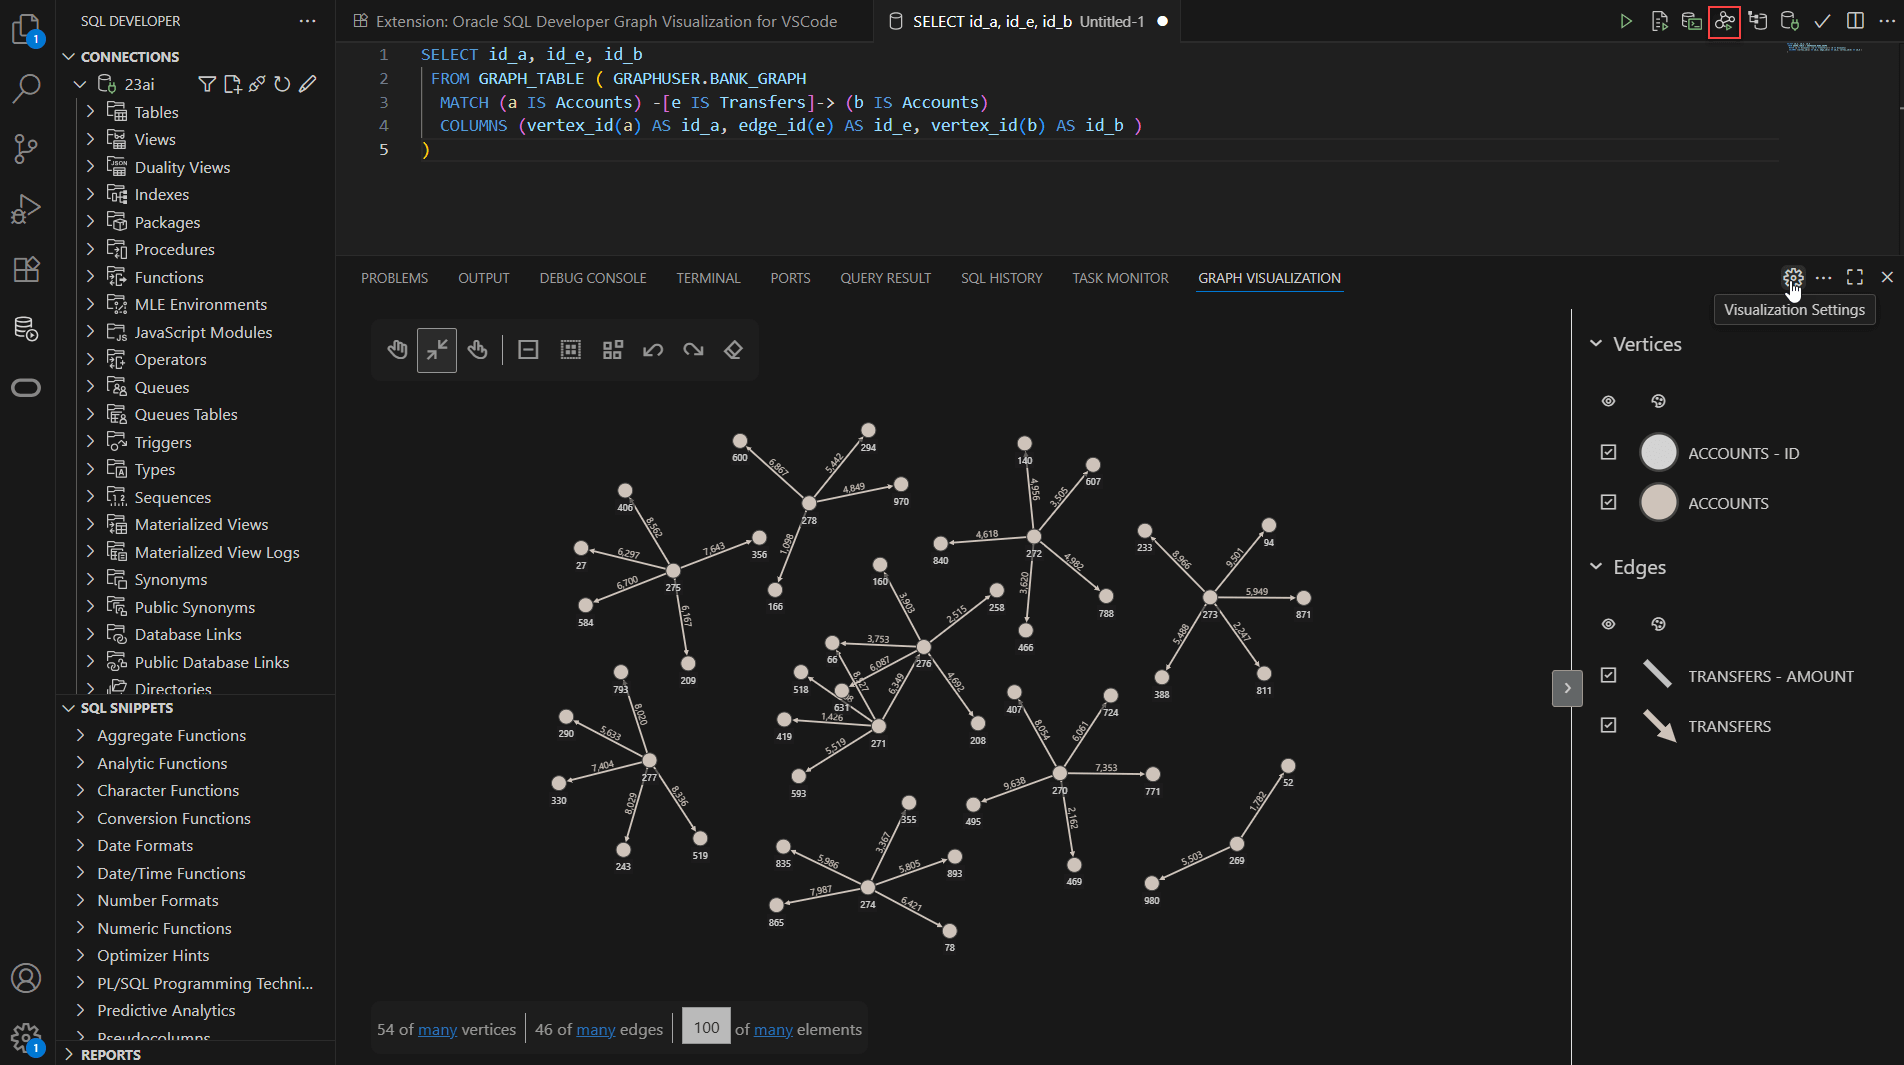
  5. Click the Visualize SQL Graph button in the editor toolbar on the top (shown highlighted in the following figure), or use the command palette (Ctrl+Shift+P) and select Visualize SQL Graph.

    The output graph is displayed in the SQL Worksheet output panel under the Graph Visualization tab. The graph visualization toolbar is displayed on top of the graph and the legend panel is displayed on the right.

    Figure 10-1 Graph Visualization of SQL Graph Queries in VS Code


    See Also:

  6. Optionally, click Visualization Settings to add captions, new styles, or edit the default legend styles.