Managing the Display Size of the Graph
You can use the Display Size visualization setting to control the number of graph elements (vertices and edges) to be displayed in the Graph Visualization panel.
The default Display Size value is 100. For instance, consider the following example visualization:
Figure: Default Display Size
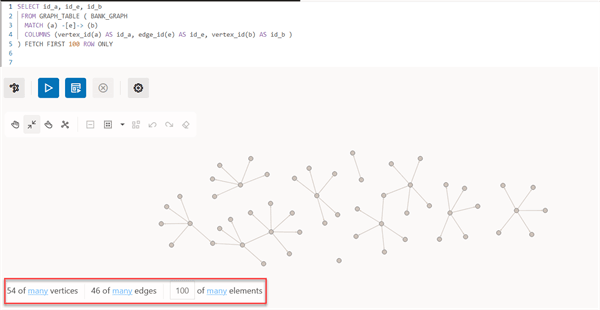
Description of the illustration gviz_default_pagination.png
In the preceding figure:
-
54 of many vertices: This indicates 54 vertices are displayed and
manyindicates the total number of vertices in the graph. -
46 of many edges: This indicates 46 edges are displayed and
manyindicates the total number of edges in the graph. -
100 of many elements: This indicates 100 elements are displayed and
manyindicates the total number of graph elements.
Also, the following actions are supported for customizing the graph display size:
- You can dynamically change the total number of graph elements (shown highlighted in the following figure) to be displayed in the graph.
Figure: Dynamically Updating Display Size

Description of the illustration gviz_update_pg_total.png
-
You can click
manyto view the total number of vertices, edges, and graph elements in the graph.A progress bar showing the percentage of the graph that is displayed in the panel appears along with the percentage value.
Figure: Progress Slider to Control Graph Display

-
You can move the slider to dynamically change the number of vertices or edges that you wish to display for visualization.