Using the Graph Server Administrator Dashboard
The graph server administrator can efficiently track and manage the memory usage of the graph server (PGX) using the Administrator Dashboard.
You can access the Administrator Dashboard only if you are granted the GRAPH_ADMINISTRATOR role having the PGX_GET_SERVER_INFO privilege.
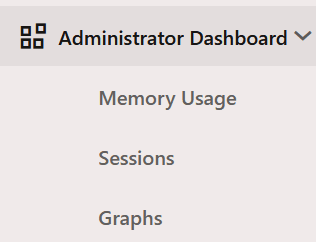
The user-friendly interface of the Administrator Dashboard comprises the following components:
-
Memory Usage: To view data charts on real-time memory usage, study the current memory consumption patterns and identify any potential issues.
-
Sessions: To manage, monitor, and search active user sessions.
-
Graphs: To track and monitor memory usage per graph for all the active users.
Perform the following steps to access the Administrator Dashboard:
-
Open the following URL in your web browser.
https://<server_host>:7007/dash/The Graph Dashboard login screen opens.
-
Enter your Username and Password.
-
Click Submit.
-
Click Administrator Dashboard in the left navigation menu.
The Memory Usage page of the Administrator Dashboard opens.
-
Optionally, click Sessions or Graphs to navigate to the respective pages.
Figure: Administrator Dashboard Menu
-
Memory Usage
The Memory Usage dashboard provides in-depth information on the amount of memory used by the graph server (PGX). -
Sessions
The Sessions page displays all the active user sessions. -
Graphs
The Graphs page lists the graphs for all the active users and provides the total memory usage for each graph.