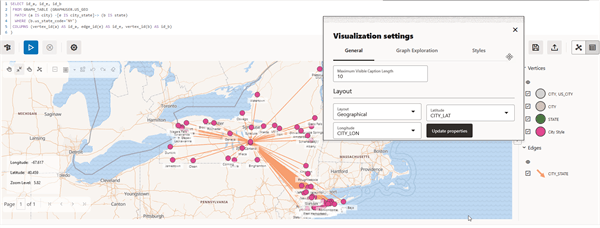
Using the Geographical Layout
You can use the Geographical layout to show the graph (vertices and edges) on a global map in the Graph Visualization application.
In order to view your vertices on a map, they must include a geographical location, in the form of a pair of properties that contain the longitude and latitude coordinates for that vertex. You can use any name for the longitude and latitude properties (such as X and Y, or long and lat). For example:
US_CITY                CITY_LAT   CITY_LON
-------------------- ---------- ----------
Binghamton              42.1014   -75.9093
Utica                   43.0961    -75.226
New Rochelle            40.9305   -73.7836
Saratoga Springs        43.0674   -73.7775
New York                40.6943   -73.9249
However, you must ensure that the longitude and latitude pair are in the WGS84 system (GPS coordinates), and the coordinates are expressed in decimal degrees.
Perform the following steps to apply geographical layout:
-
Click the Settings gear icon to open the graph Visualization settings dialog.
-
Click the General tab.
-
Select Geographical Layout in the Layout section.
-
Select the Latitude and Longitude properties.
-
Click Update properties.
-
Close the Visualization settings dialog.
The following shows an example graph rendered on a geographical layout in the Graph Visualization application.
Figure: Geographical Layout