Creating a Property Graph Using the Visual Editor
The visual editor in Modeler enables you to build a property graph interactively by adding vertices and edges to a canvas. You can create a graph from scratch, continue editing a graph created using Auto Map or Graph Assistant, configure graph elements, preview the graph structure, and finally create the graph in the database.
-
Click Modeler under Graph Tools in the Graph Studio navigation menu.
-
Click New Graph on the Modeler landing page.
A new graph tab opens. If Auto-name New Graphs is enabled in Settings, a default graph name is generated automatically and displayed as the tab name. Otherwise, you can specify the graph name before creating the graph.
-
Select the required Graph Type.
Modeler supports the creation of two types of property graphs:
-
SQL Property Graph: The option to create a SQL property graph is available only if you are using a database instance with Oracle Database 26ai.
-
PGQL Property Graph: The option to create a PGQL property graph is available on all supported database versions.
-
-
Build the graph by interacting with the canvas.
The visual editor provides the following tools:
Figure: Visual Editing Tools
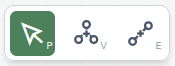
Description of the illustration modeler_visual_editor_tools.png
-
Select: Select a graph element on the canvas.
-
New Vertex (V) – Add a new vertex to the graph by dragging the tool onto the canvas.
-
New Edge (E) – Create a relationship between two vertices by dragging from the source vertex to the destination vertex.
The visual editing tools enable you to perform the following actions:
- Add a vertex:
-
Drag the New Vertex icon onto the canvas to create a new vertex.
Figure: Adding a vertex visually
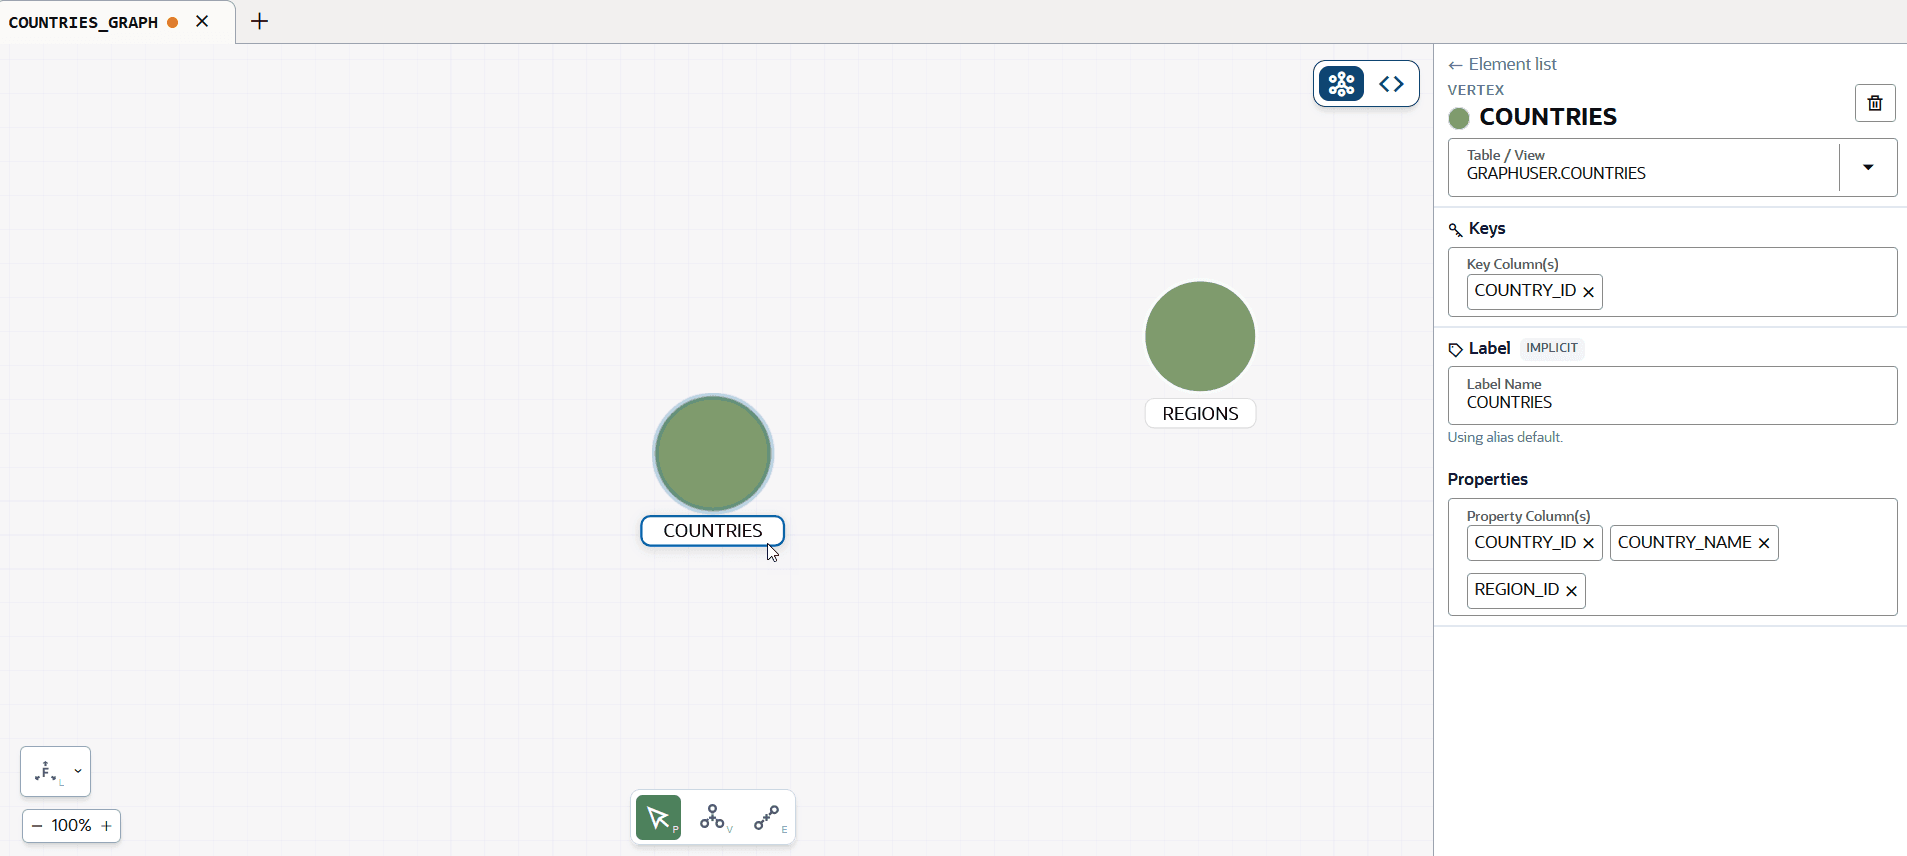
Description of the illustration modeler_create_vertex_visually.png
The graph element details are displayed in the Element pane on the right.
-
Select a Table/View for the vertex.
-
Specify one or more Key Columns.
-
Optionally, modify the Label Name.
-
Select the Property Columns to include as vertex properties.
-
-
Add an edge:
An edge represents the relationship between two vertices.
-
Click the New Edge icon.
-
Click the New Edge icon, and drag an edge from source vertex to destination vertex.
Figure: Adding an edge visually
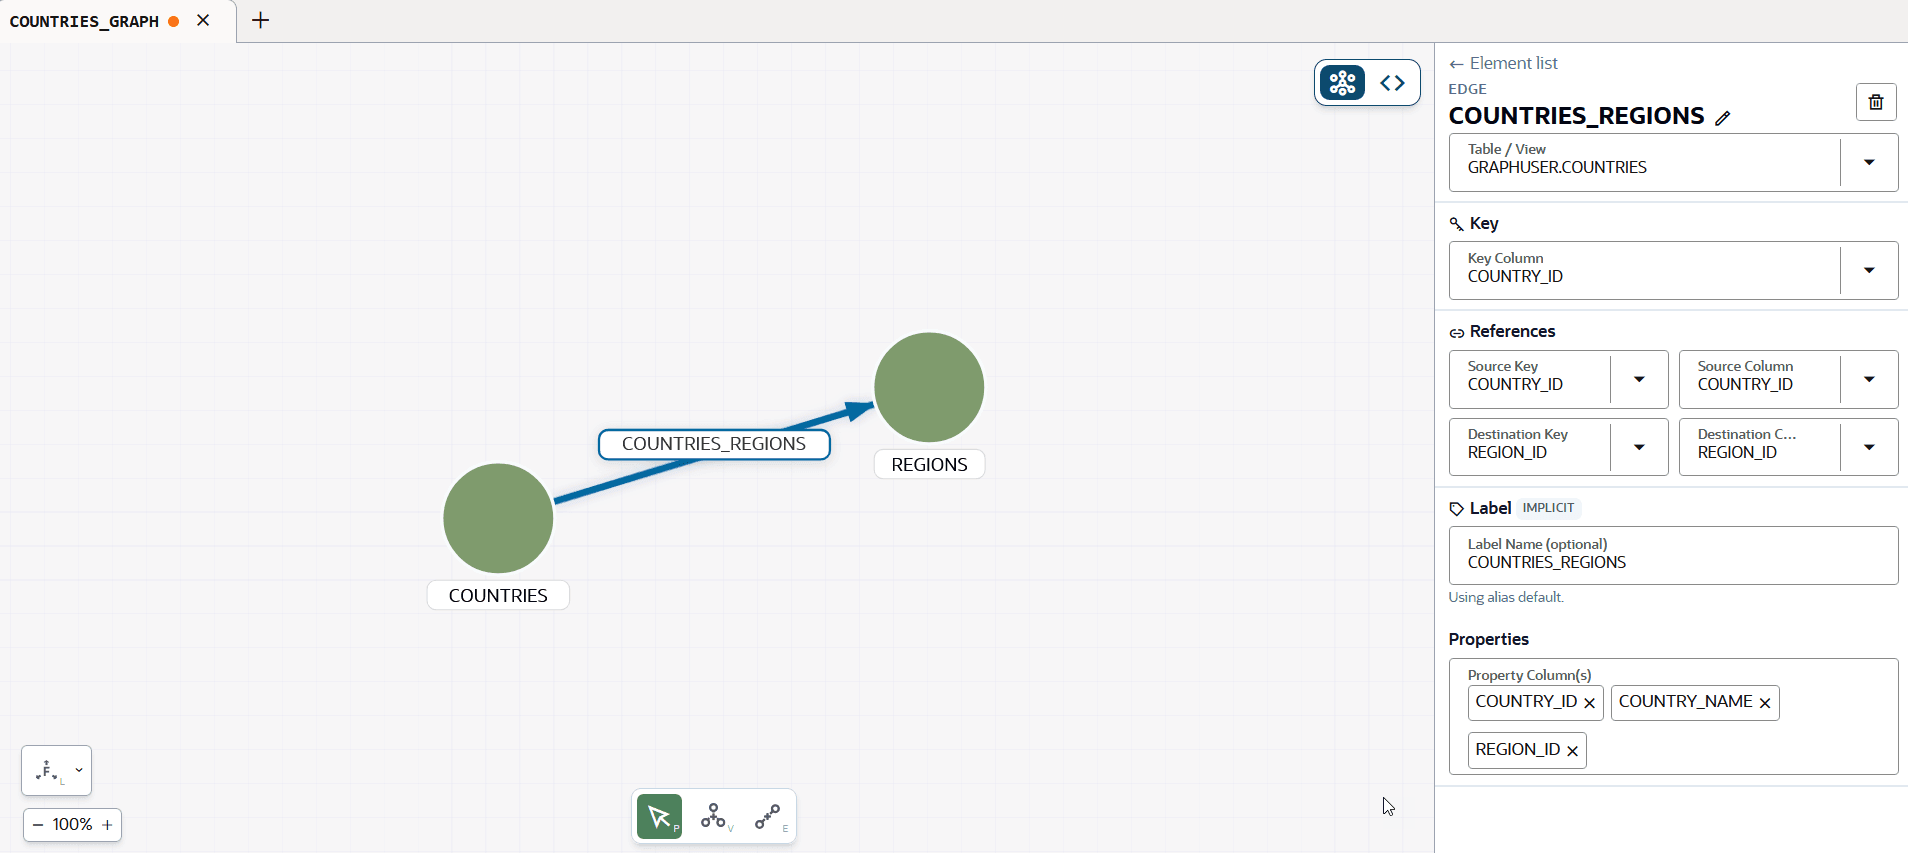
Description of the illustration modeler_create_edge_visually.png
You can also create self-loops visually by clicking and dragging an edge from a vertex and dropping it back onto itself.
The edge details are displayed in the element pane on the right.
-
Select the Table/View for the edge.
-
Specify the Key Column.
-
Configure the Source Key, Source Column, Destination Key, and Destination Column.
-
Optionally, modify the Label Name.
-
Select the Property Columns to include as edge properties.
-
See Handling Errors and Warnings While Creating a Graph for more information on errors and warnings displayed during graph creation.
-
-
Click Create Graph in the top right of the page.
The graph is created and you can interact with the graph using Graph Explorer.