Explain Plan
The Execute Explain Plan icon generates the execution plan, which you can see by clicking the Explain Plan tab. The execution plan is the sequence of operations that will be performed to execute the statement.
The Explain Plain diagram view is a graphical representation of the contents of PLAN_TABLE, which is the default table for the results of the EXPLAIN PLAN statement.
By default, three levels of steps are visible in the diagram. You can use the +/- signs at the bottom of each step (available when the step has children) to expand or collapse. To view all steps in the diagram, use  Expand All in the toolbar.
The diagram also provides the following details:
-
Cardinality (number on the arrow to the parent step), which is the number of rows processed
-
Operation and options applied in that step
-
Execution order, which is the sequential number in the order of execution
-
Access predicates CPU cost in percentage (orange bar)
-
Total CPU cost for the step in percentage (blue circle)
-
Estimated I/O Cost, Bytes processed and Cost metrics
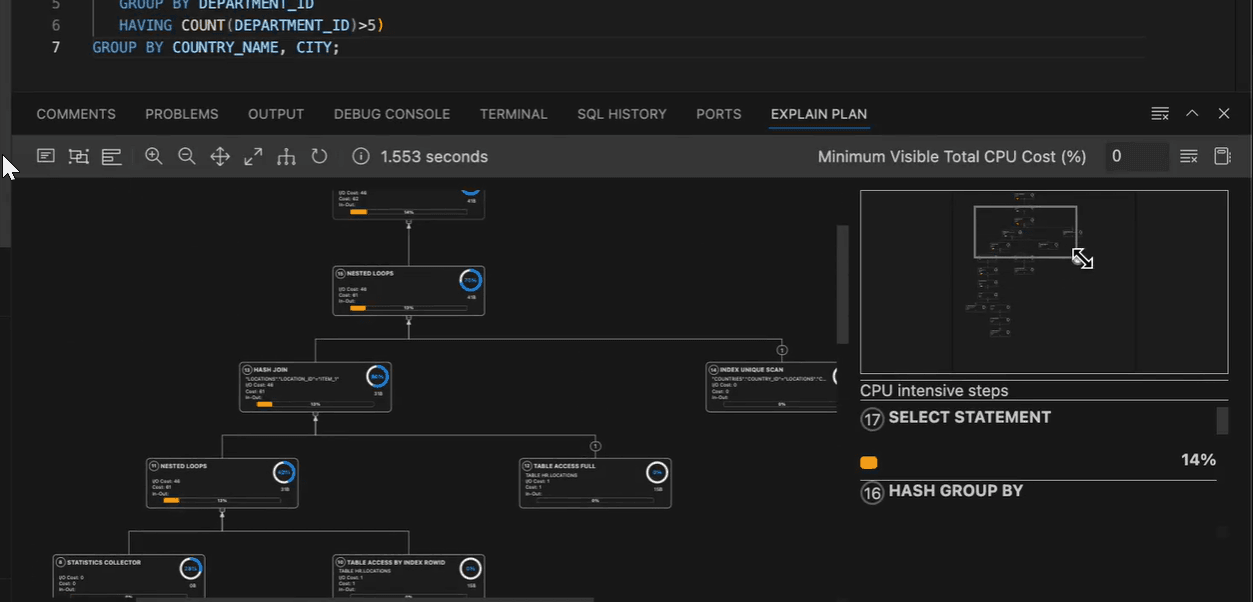
Description of the illustration explain_plan.png
You see a brief description pop-up when you hover over any of the statistics in a step.
The icons in the toolbar are:
-
Text View: Displays the execution steps in a plain text format.
For the Text View, you can select the level of detail displayed in explain plan by selecting the appropriate option in Using Preferences.
-
Diagram View: Displays the execution steps in a flowchart format.
-
Chart View: Displays data from
PLAN_TABLEa flame graph. -
Advanced View: Displays data from
PLAN_TABLEin a mixed tabular/tree view. -
Zoom In, Zoom Out: If a step is selected in the diagram, clicking the Zoom In icon ensures that it remains at the center of the screen.
-
Fit Screen: Fits the entire diagram in the visible area.
-
Actual Size: Sets the zoom factor to 1.
-
Expand All: Displays all steps in the diagram.
-
Reset Diagram: Resets the diagram to the initial status, that is, only three levels of steps are displayed.
-
Show Info: Shows the
SELECTstatement used by the Explain Plan functionality. -
Min Visible Total CPU Cost(%): Defines the threshold to filter steps with total CPU cost equal or more than the provided value.
Enter a value between 0 and 100. There is no filtering for 0.
-
Plan Notes: Displays the Explain Plan notes.
Properties
Double-click or press Enter on a selected step to open the Properties slider, which provides more information about that step. See PLAN_TABLE in Oracle Database Reference for a description of each property.
The Properties slider shows:
-
All information for that step extracted from
PLAN_TABLEin a tabular format. Nulls are excluded.You can select JSON to view the properties in JSON format.
-
Information from
OTHER_XMLcolumn ofPLAN_TABLE.The information is displayed in JSON format.
Navigation
-
Press the Tab key to move through the steps in the execution order. The selected step has a blue border around it.
To move in the reverse direction, press the Shift + Tab keys.
If no step is selected, pressing the Tab key selects the step with execution number 1.
-
Depending on the zoom level, use horizontal and vertical scrollbars to view different parts of diagram.
Click the left mouse button and hold it to pan the diagram around up and down.
Use the
 icon at the bottom right to scroll to the top of the diagram.
Diagram Navigator
The Diagram Navigator is at the top right corner and represents a smaller copy of the diagram. The rectangle border allows zoom-in and zoom-out operations and moves to show different parts of the diagram.
The diagram navigator shows a list with steps having more than 1% CPU cost in descending order. Click a step in the list to navigate to the same step in the diagram, enabling you to see it in the context of the other steps.