Performance Reports
SQL Developer for VS Code provides the following performance reports under the DBA node for reviewing database activity and workload information.
-
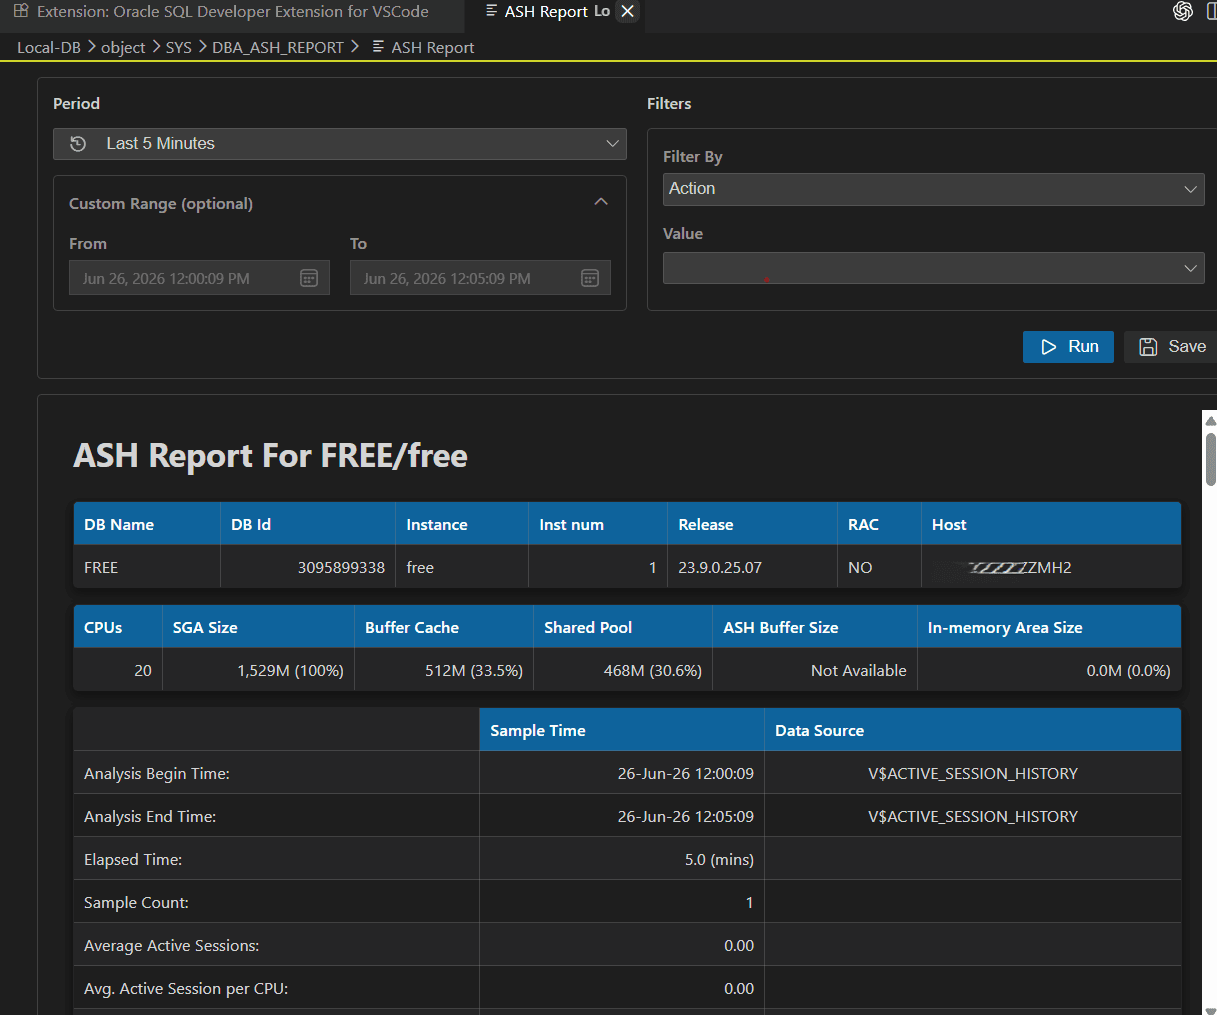
Active Session History (ASH) Report: It provides a focused view of active database session activity for a selected time period. In SQL Developer for VS Code, you can generate an ASH report for a predefined period, such as the last 5, 10, 30, or 60 minutes, or specify a custom time range. You can also apply filters to narrow the report to specific database activity. The generated HTML report helps you review what active sessions were doing during the selected period, including session activity, wait information, sample time, and related performance details.
-
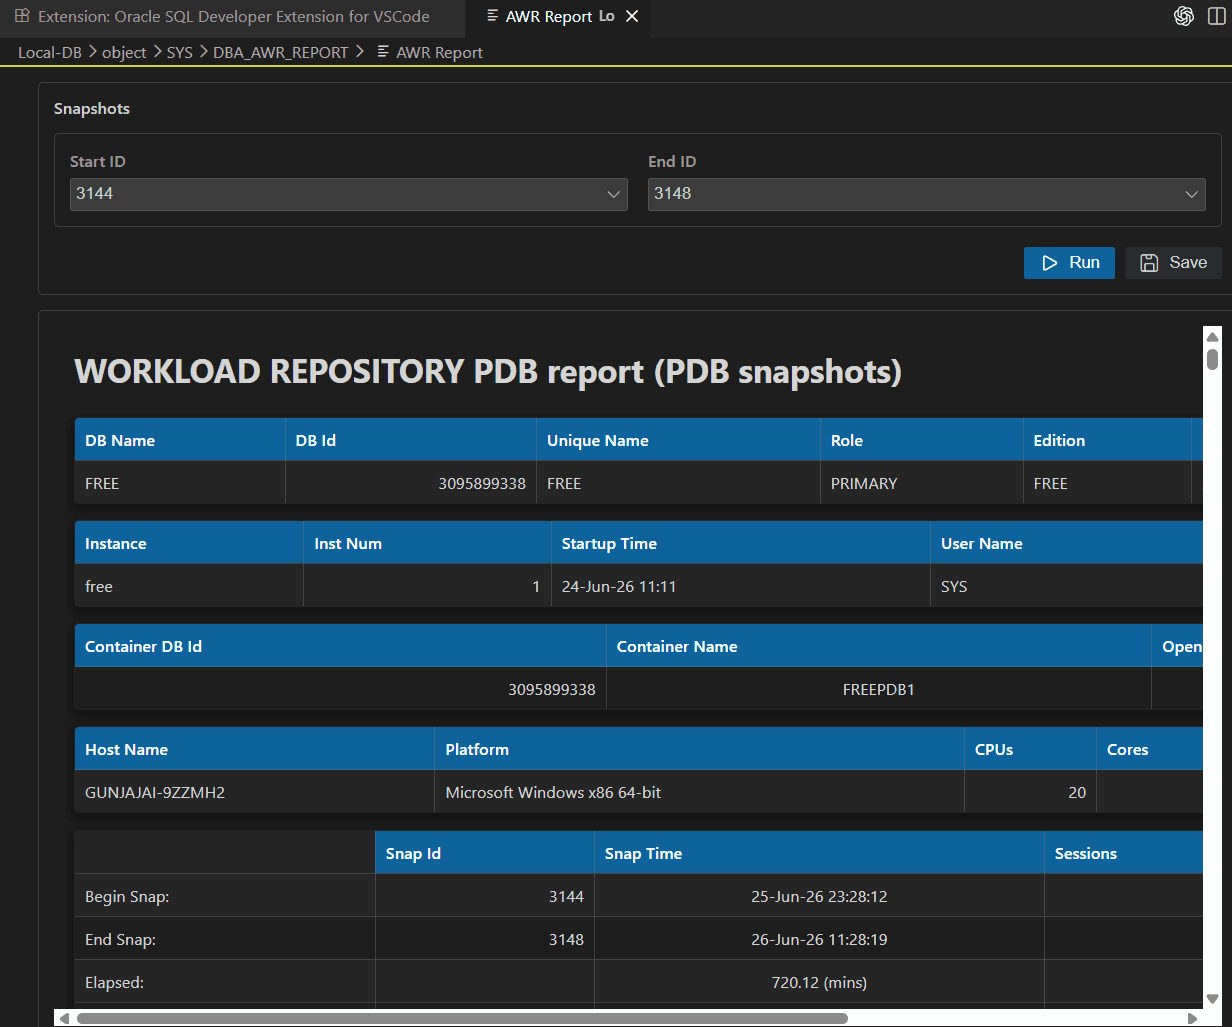
Automatic Workload Repository (AWR) Report: It provides a summary of database workload and performance information between two AWR snapshots. In SQL Developer for VS Code, you can select a starting snapshot and an ending snapshot, generate an HTML report for that interval, review the report output in the viewer, and save it locally. The report helps you analyze database workload trends and performance characteristics captured by the database during the selected snapshot range.
Active Session History (ASH) Report
Use ASH Report to analyze active session activity for a selected time period.
Grant the following privileges to the database user that opens the report.
-
grant select on DBA_HIST_DATABASE_INSTANCE to <user>;
-
grant select on DBA_HIST_ACTIVE_SESS_HISTORY to <user>;
-
grant execute on DBMS_WORKLOAD_REPOSITORY to <user>;
Perform the following steps to view an ASH report:
-
In the Connections panel, expand your database connection tree.
-
Expand DBA, and then expand Performance.
-
Select ASH Report.
The ASH Report page opens.
-
In the Period field, select the report period.
You can select a predefined period, such as Last 5 Minutes, Last 10 Minutes, Last 30 Minutes, or Last 60 Minutes. To specify a custom period, select Specified, and then enter values in the From and To fields.
-
Optionally, apply a filter in the Filters section.
In the Filter By field, select one of the available filter types: Action, Client, Module, SQL, Service, Session, Wait Class.
-
In the Value field, select or enter the filter value.
-
Click Run.
The ASH report is generated and displayed in the report viewer.
-
Review the report output.
The report includes information about the selected database activity for the specified period, such as database details, sample time, data source, elapsed time, active session information, and related activity details.
-
Click Save to save the generated report, if required.
Automatic Workload Repository (AWR) Report
Use AWR Report to review database workload information between two Automatic Workload Repository snapshots.
Grant the following privileges to the database user that opens the report.
-
grant select on
DBA_HIST_SNAPSHOTto <user>; -
grant execute on
DBMS_WORKLOAD_REPOSITORYto <user>;
Perform the following steps to view an AWR report:
-
In the Connections panel, expand your database connection tree.
-
Expand DBA, and then expand Performance.
-
Select AWR Report.
The AWR Report page opens.
-
In the Start ID field, select the starting snapshot.
The snapshot list displays available snapshot information, such as snapshot ID, start interval time, and end interval time.
-
In the End ID field, select the ending snapshot.
-
Click Run.
The AWR report is generated and displayed in the report viewer.
-
Review the report output.
The report includes database workload and performance information for the selected snapshot range.
-
Click Save to save the generated report, if required.