8.11 The Waits Page
Note:
Available only if you signed in as a database user with DBA and PDB_DBA roles for Oracle Database 18c and previous releases.To navigate to the Waits page, do either of the following:
-
In the Launchpad page, click Waits.
-
Click Selector
 to display the navigation menu. Under Monitoring, select
Waits.
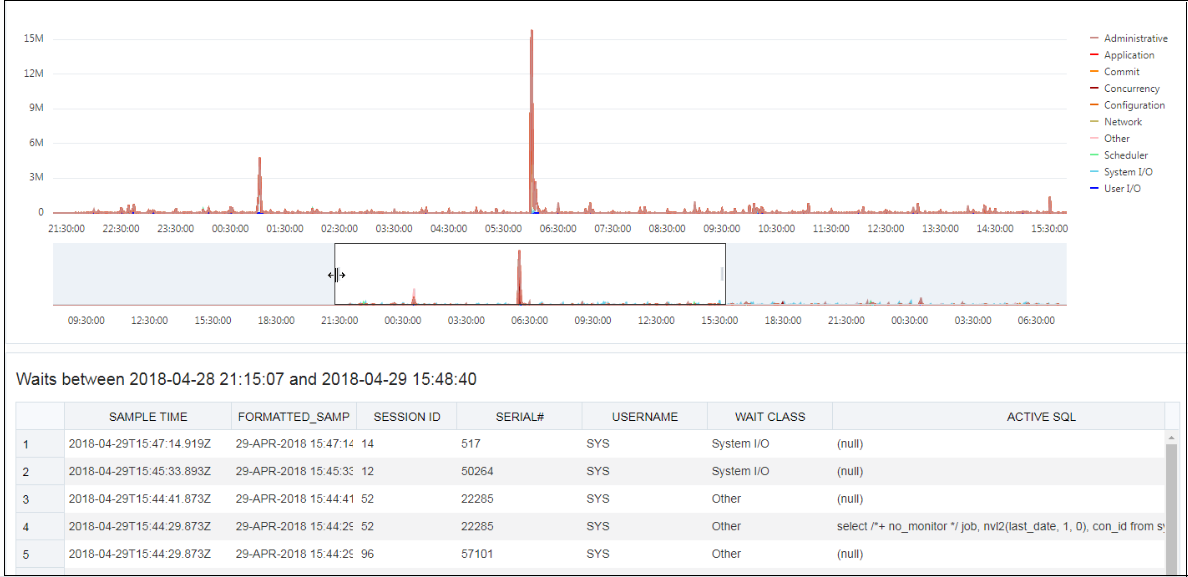
Use the slider controls to zoom in on a specific time period. To use the slider controls, place the cursor over the handles at both sides of the box and drag the sides to the time period required. The chart above will refresh to the selected time period. The table will also automatically refresh and the wait events will filter to that period of time enabling you to easily identify the problem SQL statement.
Figure 8-6 Distribution of Wait Events Chart

Description of "Figure 8-6 Distribution of Wait Events Chart"
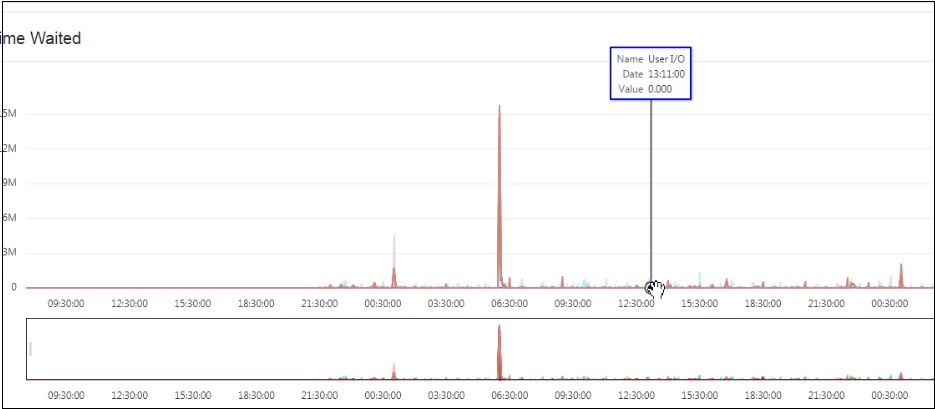
When you place the cursor over data points in the chart, a pop-up box displays details about the wait event.
