Creating or Editing a Dashboard

This section describes the steps to create or edit a dashboard.

To create a dashboard, in the Charts and Dashboard page, at the top right, click Create and then select New Dashboard.

To edit a dashboard, click the Actions icon and select Edit.

  1. In the Create a Dashboard pane, enter or edit the following fields:
    • Name: Enter a name for the dashboard.
    • Published: Select this option to make the dashboard available for use.
    • Description: Enter a description for the dashboard.
    • Protected by Privilege: Select an available privilege from the drop-down list to enable only those with this privilege to securely access the dashboard.
    • Go to Dashboard details after creation: Select this option to go to the main Charts and Dashboards page after creating the dashboard.
  2. Click Create or click Save, if editing. The Layout page is displayed
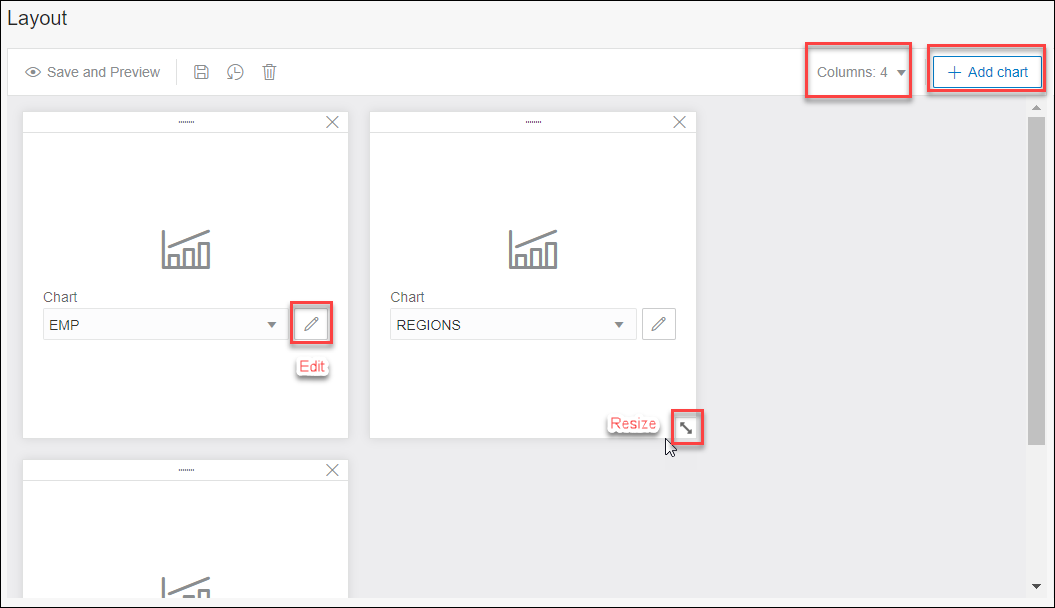
  3. In the Layout page, you can add charts and design the layout for the dashboard. Click Add Chart.
    • In the Select Chart pane, for the Selection tab, select the chart to add from the drop-down list.

      You can select the Custom option and enter a URL for the chart from your schema or from a different schema. The URL must point to the REST Module root, for example, http://xxxx.oracle.com:1234/ords/hr/sdw/charts/Chart01/. Also, you need to have the associated privileges to view the chart.

      A preview of the selected chart is displayed. You can change the refresh rate of the chart, display the chart in Chart or tabular format, or share the chart by copying the URL.

    • In the Settings tab, select Chart and Data Grid to enable both views for the chart. By default, the Chart view is displayed in Preview.
  4. Click Create.

    The chart is added to the Layout section.

  5. Add more charts as needed to the dashboard. The maximum is 3 or 4 based on the number of columns that you select from the Columns drop-down list.
    • You can reorder the charts by dragging them horizontally or vertically to move them to the required position.

    • Use the Edit icon on a chart to edit the chart if needed. You can also change the chart by selecting from the drop-down list.

    • Drag the double-sided arrow at the right corner to resize the chart.

  6. Click Save and Preview to save the layout and display a preview of the dashboard.

    The dashboard is displayed on a new page. For each chart, you can change or customize the refresh rate, display the chart in Chart or tabular format, or share the chart by copying the URL.