8.9.3.1 Creating an Incident Rule
An incident rule specifies condition details that trigger a resource broker policy. The condition can be complex and made up of criteria combination that represents the event characters (for example, the event type, severity, category, and etc.). By defining incident rules, you can specify when one of the following conditions is met, the deployment policies are evaluated:
- The CPU utilization of a host reaches 85%
- The average execution time of certain Tuxedo service exceeds 500 microseconds
- Some Tuxedo machines are down, etc.
An incident rule can contain any metrics provided by any monitored target. To allow the incident rule to be evaluated on specific targets, create the Enterprise Manager Group on the targets and refer to this group in the rule set.
The following steps are given as an example to introduce how to define a CPU metric even type. Before creating a policy, you need to create incident rules.
- From the Enterprise Manager console home page, click Setup-> Incidents -> Incident Rules
- On the Incident Rules page, click Create Rule Set...
- Enter a rule name, and choose Specific targets on the Targets tab at the bottom of the page.
- Add your predefined Enterprise Manager Group(s) which contain(s) the target events under consideration.
Note:
Selecting specific groups in this step is important, otherwise all the events of same type on any target implements the incident rule. - Choose the Rules tab. Click Create to create a incident rule.
- Click Continue in the pop-up window to define an event-type incident rule.
- In the page that appears, select Type. Choose Metric Alert in the list.
- Choose Specific events of type Metric Alert
A Metric Alert panel appears.
- Click Add to designate a specific Metric Alert event.
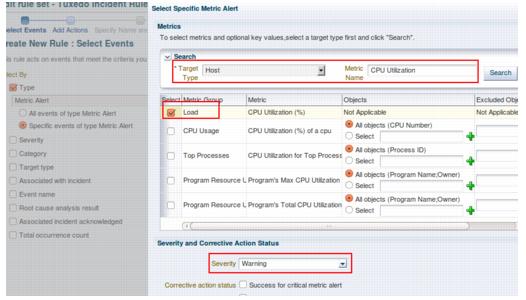
- In the Select Specific Metric Alert page, define an incident rule carried out when the CPU utilization of one host reaches the Warning threshold, as shown in figure below:
Define a CPU Metric Event- Example
Figure 8-7 Define a CPU Metric Event- Example
- Click OK.
The newly-created event appears in the Metric Alert panel.
- Click Next to proceed to the Add Actions step page.
- In the Advanced Notifications panel, check the predefined notification named Tuxedo Event Connector (PL/SQL Procedure) .
This means when the incident is produced, Tuxedo Event Connection is notified.
- Click Continue in the upper right corner to complete the definition. Click Next.
- Enter a name in the Specify Name and Description page. Click Next, and then Continue to finish the configuration.
On the All Enterprise Rules page, you can find the incident rule is added under the Tuxedo Incident Rules rule set with “active” status.
- Return to the Edit Rule Set page. Click Save to activate the defined incident rule.
On the All Enterprise Rules page, you can find the incident rule is added under the Tuxedo Incident Rules rule set with “active” status.
Parent topic: Policies