Using ELK to Monitor Oracle NoSQL Database
“ELK” is the acronym for three open source projects: Elasticsearch, Logstash, and Kibana.
Elasticsearch is a search and analytics engine. Logstash is a server-side data processing pipeline that ingests data from multiple sources simultaneously, transforms it, and then send it to a “stash” like Elasticsearch. Kibana lets users visualize data with charts and graphs in Elasticsearch. The ELK stack can be used to monitor Oracle NoSQL Database.
Note:
For a Storage Node Agent (SNA) to be discovered and monitored, it must be configured for JMX. JMX is not enabled by default. You can tell whether JMX is enabled on a deployed SNA issuing the show parameters command and checking the reported value of the mgmtClass parameter. If the value is not oracle.kv.impl.mgmt.jmx.JmxAgent, then you need to issue the change-parameters plan command to enable JMX.
For example:
plan change-parameters -service sn1 -wait \
-params mgmtClass=oracle.kv.impl.mgmt.jmx.JmxAgent
For more information, see Standardized Monitoring Interfaces.
You can integrate Oracle NoSQL metrics and log information with an existent ELK configuration. It is recommended to install ELK components in dedicated servers. Do not use Oracle NoSQL nodes. For more information, see Elastic Stack and Product documentation. If you do not have an existent ELK setup, follow the instructions provided but always refer to elastic documentation for details. Configuration files provided must be edited if you decide to use a secure ELK deployment, according to your setup and your security requirements.
Filebeat and metricbeat help you monitor your servers and the services they host by collecting metrics, especially from the NoSQL services. Filebeat is the component that sends the files generated by the Collector Service in each Storage Node (SN) to ELK for analysis and monitoring. Filebeat component must be deployed in all NoSQL nodes of your cluster.
- install and configure Filebeat on each NoSQL cluster you want to monitor
- specify the metrics you want to collect
- send the metrics to Logstash and then to Elasticsearch
- visualize the metrics data in Kibana
- change the configuration files if you decide to use a secure ELK deployment
Enabling the Collector Service
Follow the steps below to enable collector service in Oracle NoSQL Database:
-
Set the
collectorEnabledparameter across the store totrue.plan change-parameter -global -wait -params collectorEnabled=true -
Set an appropriate value for
collectorInterval. Low interval value collects more details and requires more storage. High interval value comparatively collects lesser details and requires lesser storage.plan change-parameter -global -wait -params collectorInterval="30 s" -
Provide an appropriate storage size for
collectorStoragePerComponent. The data collected by each component (each SN and RN) is stored in a buffer. This buffer size can be changed by setting this parameter.plan change-parameter -global -wait -params collectorStoragePerComponent="50 MB"
Setting Up Elasticsearch
Follow the steps below to setup Elasticsearch:
-
Download and decompress Elasticsearch 8.7.0.
-
Modify the
$ELASTICSEARCH/config/elasticsearch.ymlfile as per your configuration.For example: Set values for
path.dataandpath.logsto store data and logs in the specified location. -
Startup Elasticsearch.
$ cd $ELASTICSEARCH
$ sudo sysctl -q -w vm.max_map_count=262144;
$ nohup bin/elasticsearch &
For more information, see Elasticsearch Reference guide.
Setting Up Kibana
Follow the steps below to setup Kibana:
-
Download and decompress Kibana 8.7.0.
-
Modify the
$KIBANA/config/kibana.ymlfile as per your configuration.For example: If Elasticsearch is not deployed on the same machine as Kibana, add line
elasticsearch.url:”<your_es_hostname>:9200”. This sets Kibana to connect to the Elasticsearch address specified instead of127.0.0.1:9200. -
Startup Kibana.
$ cd $KIBANA
$ nohup bin/kibana &
For more information, see Kibana Reference guide.
Setting Up Logstash
Follow the steps below to setup Logstash:
-
Download and decompress Logstash 8.7.0.
-
Place the
logstash.configfile in the same directory where Logstash is decompressed. Modify thelogstash.configfile as per your configuration.For example: If Elasticsearch is not deployed on the same machine as Logstash, change the Elasticsearch hosts from
localhost:9200to<your_es_hostname>:9200. -
Place the templates (
kvevents.template,
                            kvpingstats.template, kvrnenvstats.template, kvrnjvmstats.template,
                            kvrnopstats.template
) in the same directory where Logstash is decompressed. Modify the templates as per your configuration. -
Switch to the
$LOGSTASHdirectory . Verify that the directory contains the Logstash setup files, configuration file, and all the templates. Then, startup Logstash.$ cd $LOGSTASH $ logstash-5.6.4/bin/logstash -f logstash.config &
For more information, see Logstash Reference guide.
Setting Up Filebeat on Each Storage Node
Follow the steps below to setup Filebeat on each storage node:
-
Download and decompress Filebeat 8.7.0.
-
Replace the existing
filebeat.ymlwithfilebeat.yml. Edit the file and replace all occurrences of/path/of/kvrootwith the actual KVROOT path of this SN. Also, replaceLOGSTASH_HOSTwith the actual IP of Logstash. -
Startup Filebeat.
$ cd $FILEBEAT $ ./filebeat & -
Repeat the above steps in all the storage nodes of the cluster.
For more information, see Filebeat Reference guide.
Configure security for the Elastic Stack
Security needs vary depending on whether you’re developing a test environment or securing all communications in a production environment. The following scenarios provide different options for configuring the Elastic Stack.
Minimal security (Elasticsearch Development)
You can use this to set up Elasticsearch on your test environment. This configuration prevents unauthorized access to your cluster by setting up passwords for the built-in users. You also configure password authentication for Kibana. This minimal security scenario is not sufficient for production mode clusters. If your cluster has multiple nodes, you must enable minimal security and then configure Transport Layer Security (TLS) between nodes.
Basic security (Elasticsearch Production)
This scenario builds on the minimal security requirements by adding transport Layer Security (TLS) for communication between nodes. This additional layer requires that nodes verify security certificates, which prevents unauthorized nodes from joining your Elasticsearch cluster.
Basic security plus secured HTTPS traffic (Elastic Stack)
This scenario builds on the one for basic security and secures all HTTP traffic with TLS. In addition to configuring TLS on the transport interface of your Elasticsearch cluster, you configure TLS on the HTTP interface for both Elasticsearch and Kibana. If you need mutual (bidirectional) TLS on the HTTP layer, then you’ll need to configure mutual authenticated encryption. You then configure Kibana and Beats to communicate with Elasticsearch using TLS so that all communications are encrypted. This level of security is strong, and ensures that any communications in and out of your cluster are secure. For more information, see Configuring Stack Security.
 elasticsearch {
            manage_template => true
            template => "kvrnjvmstats.template"
            template_name => "kvrnjvmstats"
            template_overwrite => true
            index => "kvrnjvmstats-%{+YYYY.MM.dd}"
            hosts => "elk-node1:9200"
            user => "logstash_internal"
            password => "thepwd"
            cacert => '/etc/logstash/config/certs/ca.crt'
}
Using Kibana for Analyzing Oracle NoSQL Database
You will learn how to visualize and monitor NoSQL metrics using Kibana. Kibana requires an index pattern to access the Elasticsearch data that you want to explore. An index pattern selects the data to use and allows you to define the properties of the fields.
Using the import and export actions, you can move objects between different Kibana instances. This action is useful when you have multiple environments for development and production. Import and export also work well when you have a large number of objects to update and want to batch process them. The Saved Objects UI helps you to keep track of and manage your saved objects. These objects store data for later use, including dashboards, visualizations, maps, index patterns, Canvas workpads, and more.
In order to improve the task of creating dashboards, visualizations,
index patterns, you can use this json file that you can import in your Kibana
configuration. This is very handy to import this json file so that you can have
access to the dashboards, visualizations, index patterns that has been
provided.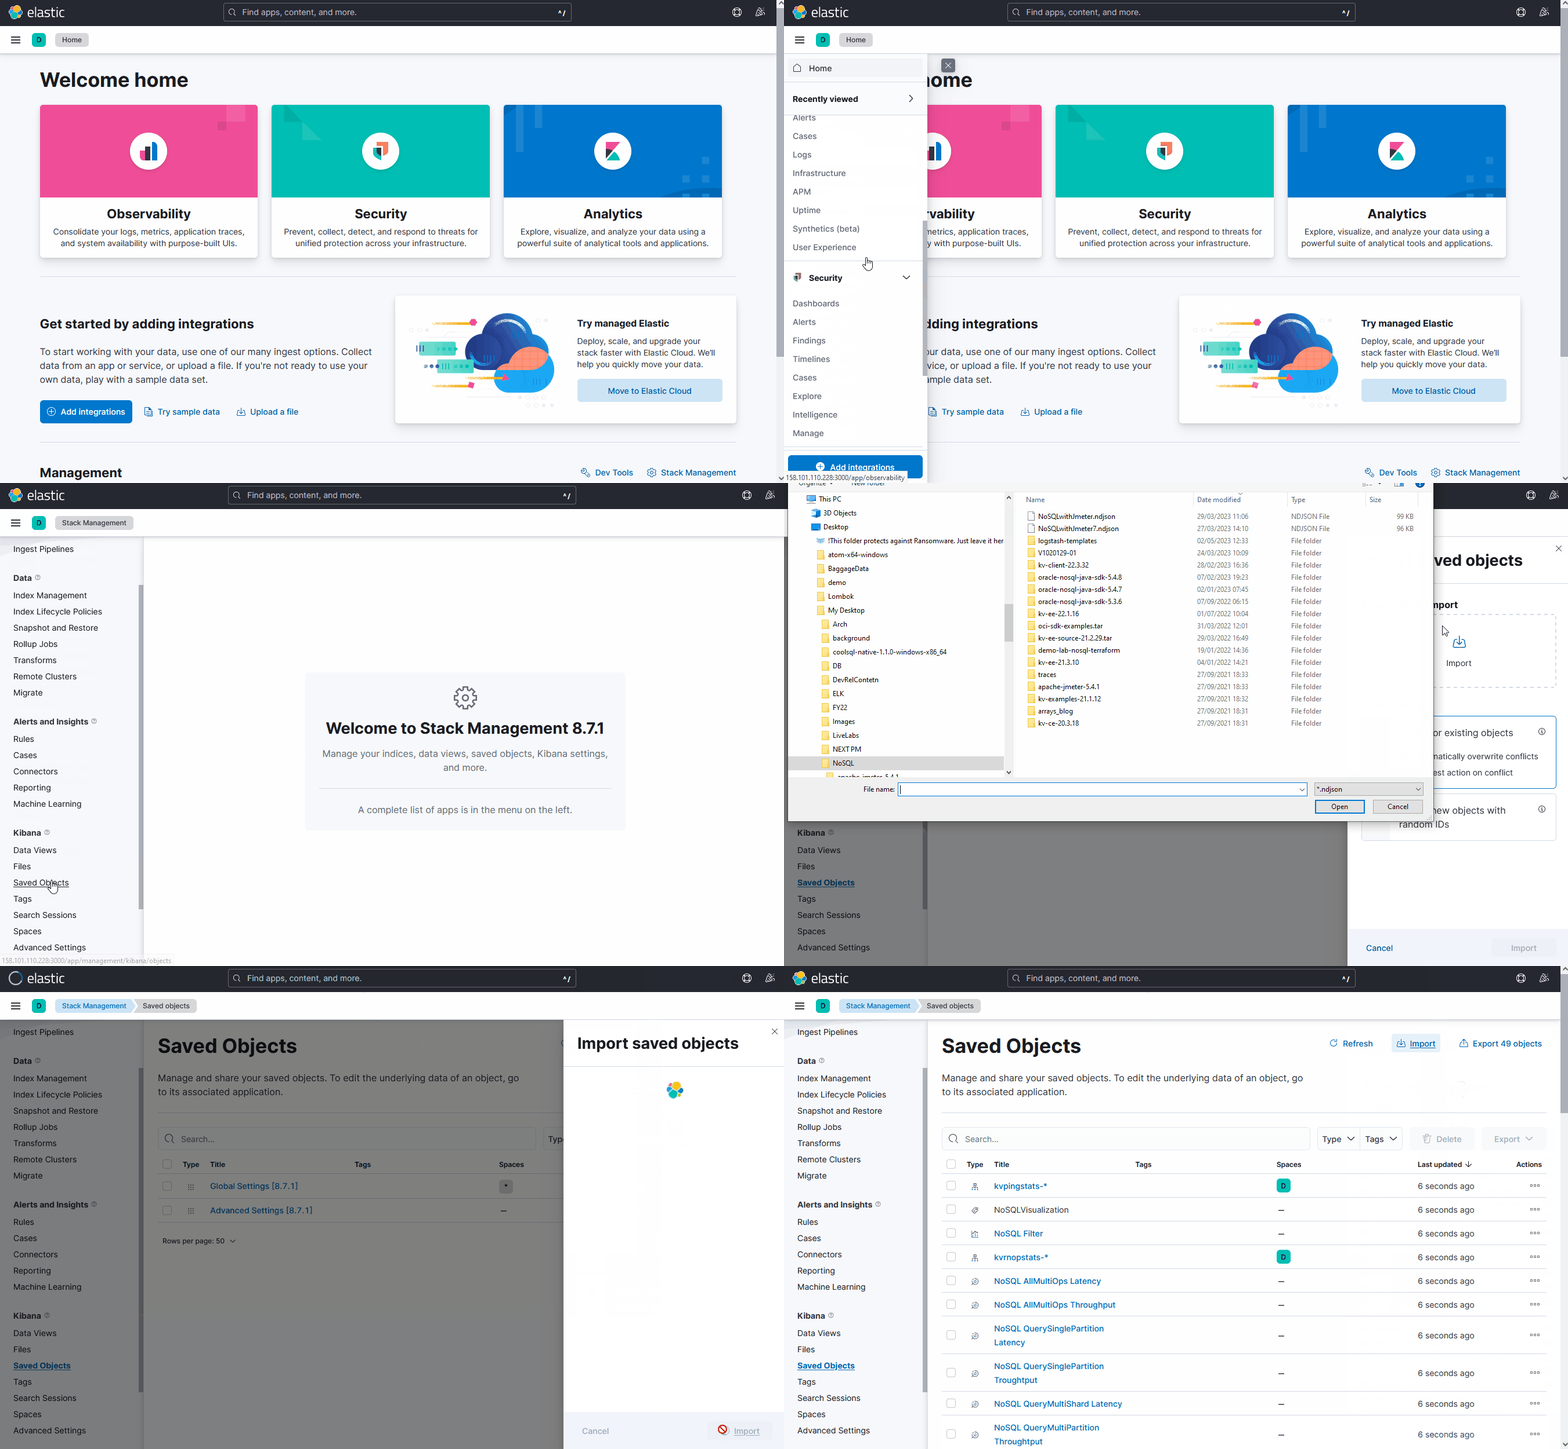
Description of the illustration kibanaimport.gif
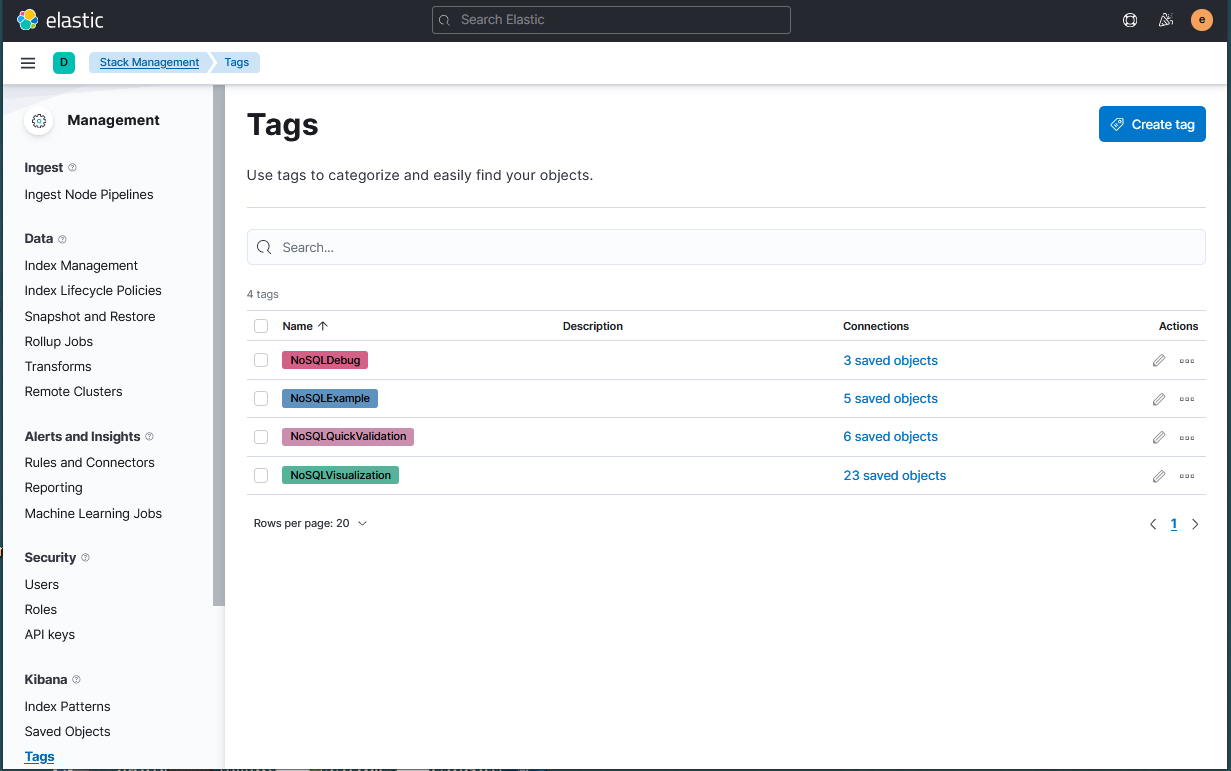
- NoSQLVisualization
- NoSQLExample
- NoSQLDebug
- NoSQLQuickValidation
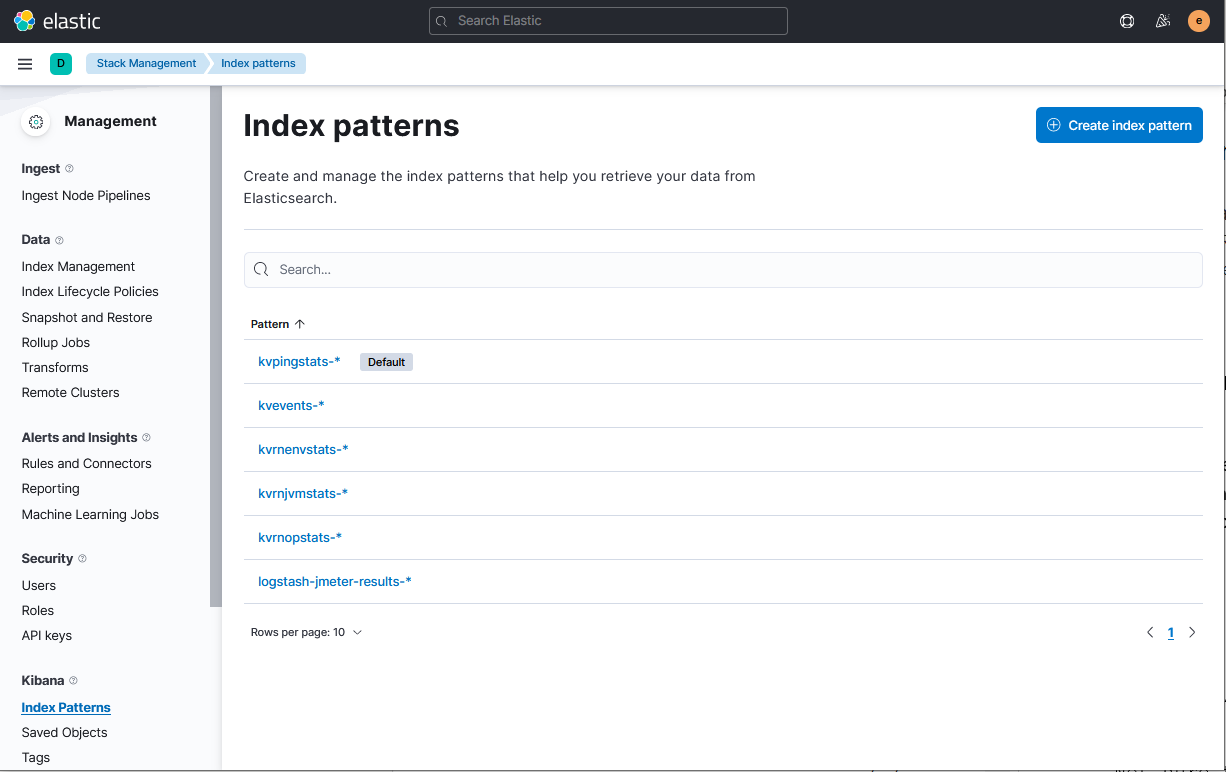
Creating Index Patterns
kvrnjvmstats-*kvrnenvstats-*kvpingstats-*kvrnopstats-*kvevents-*
Note:
This index may not exist if the store is brand new as no events have occurred.Analyzing the Data
By using the command import, you create standard visualizations that can be explored
using dashboards.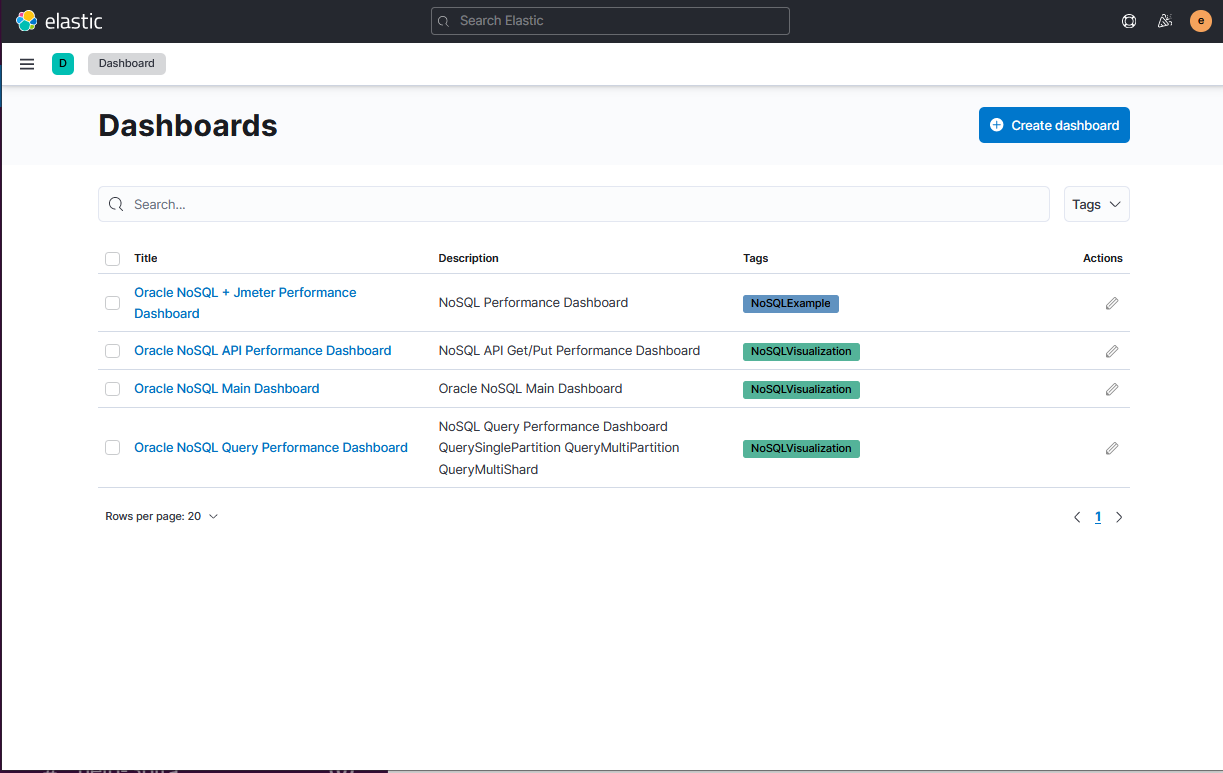
Description of the illustration kibanadashboards.png
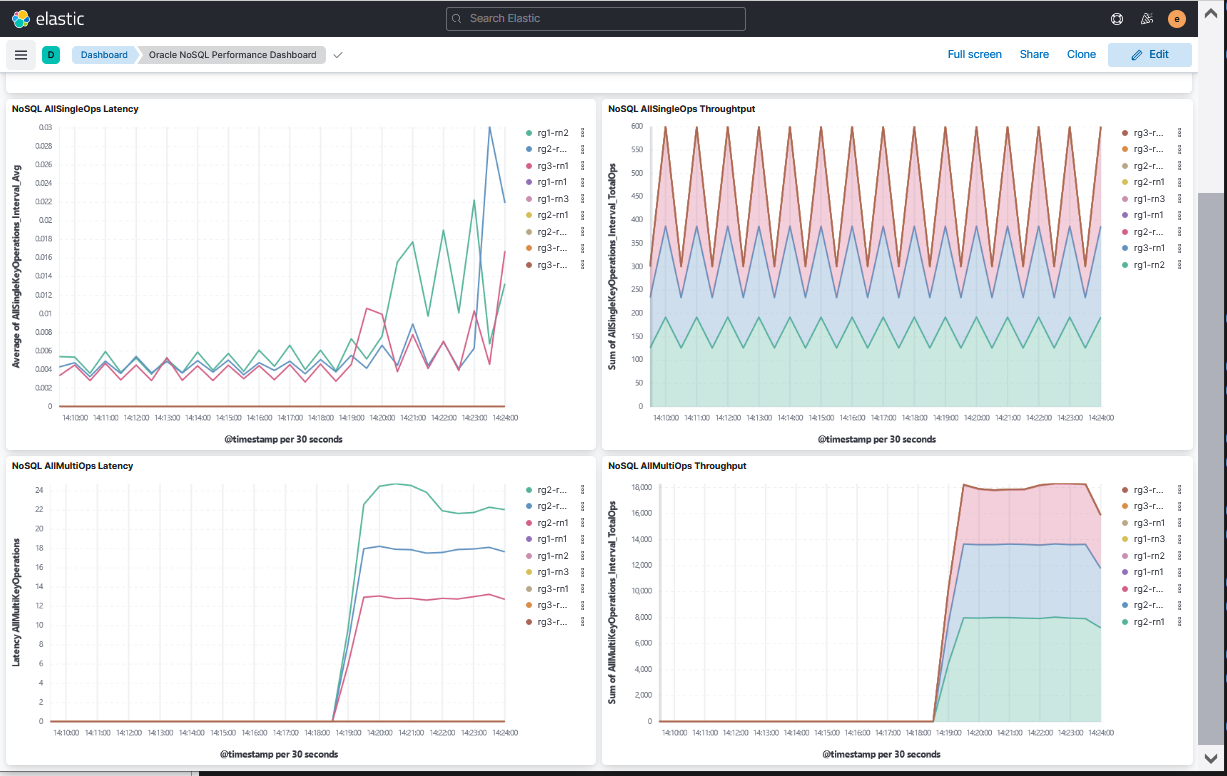
The Oracle NoSQL Main Dashboard shows you the important information about the
health of the cluster.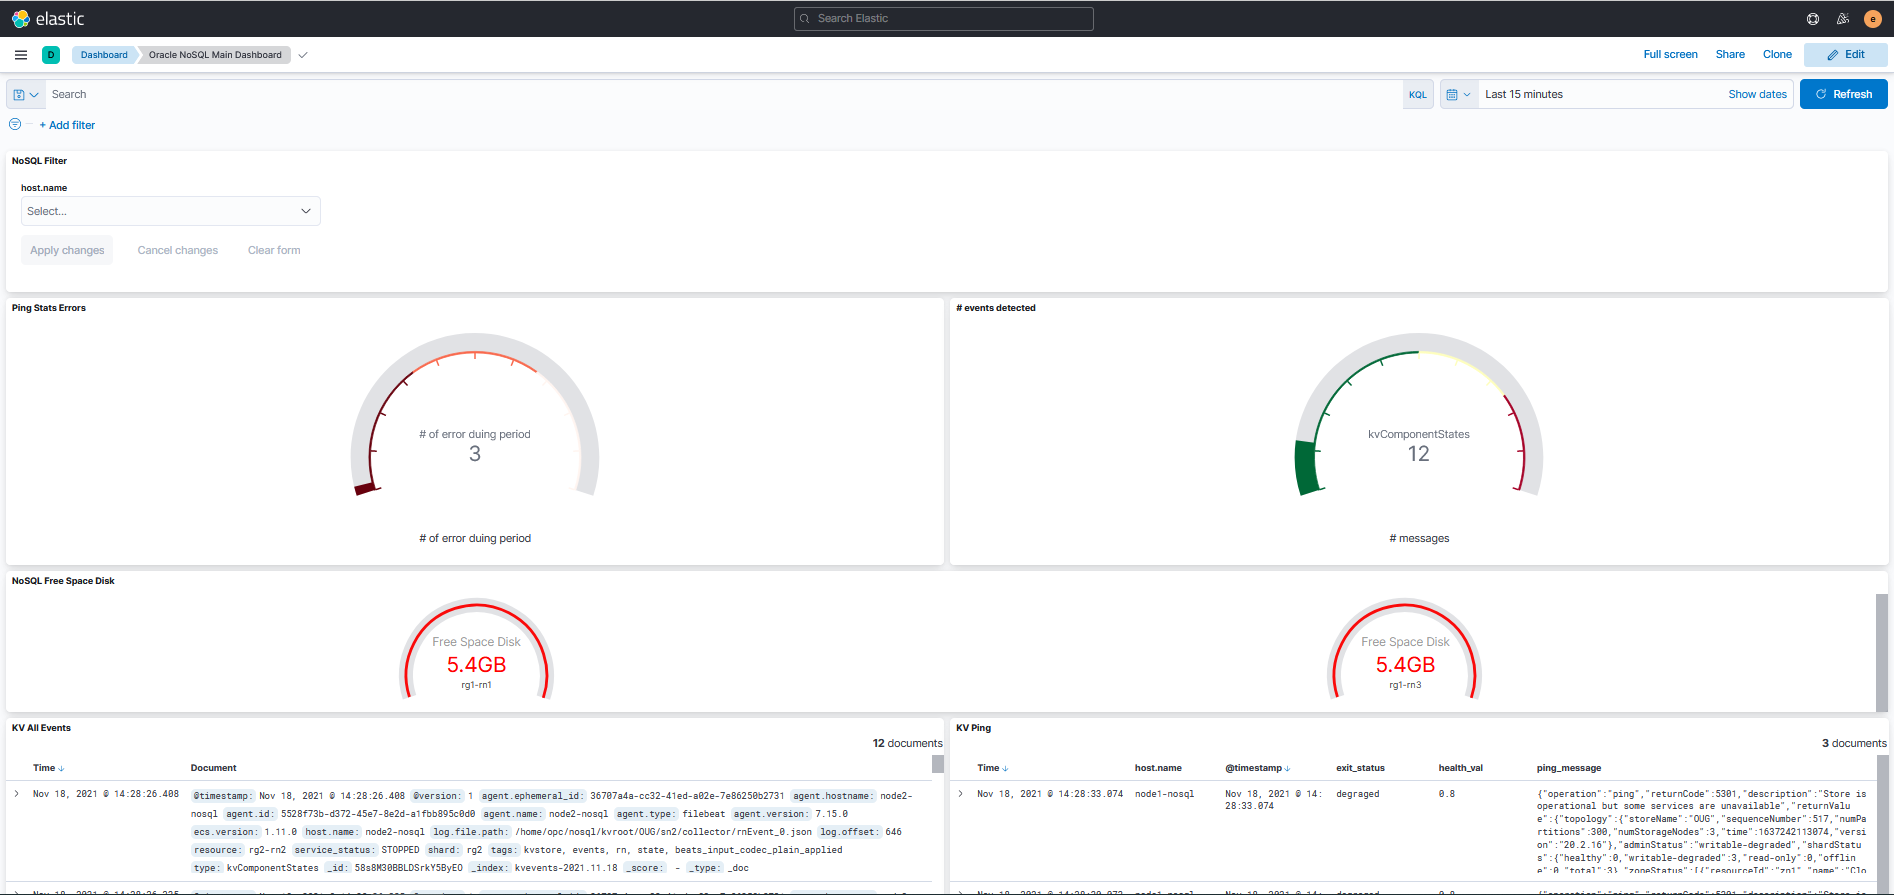
Description of the illustration kibanamaindashboard.png
- NoSQL AllSingleOps/AllMultiOps shows throughput and average latency.
- NoSQL QuerySinglePartition/NoSQL QueryMultiShard/NoSQL QueryMultiPartition
shows detailed information on SQL query performance.
- QuerySinglePartition, operations using primary key indexes
- QueryMultiShard, operations using secondary indexes
- QueryMultiPartition, operations doing full scans
- PutOps/ GetOps shows detailed information on CRUD API calls.
Oracle NoSQL exposes hundreds of metrics that could be valuable when debugging. In
order to visualize this information, visualizations are provided in the NoSQLDebug
category.You can use these visualization and also create more customized
visualizations when necessary. These metrics contain statistics of each type of API
operation. And each operation statistics is calculated by interval and cumulative
statistics. 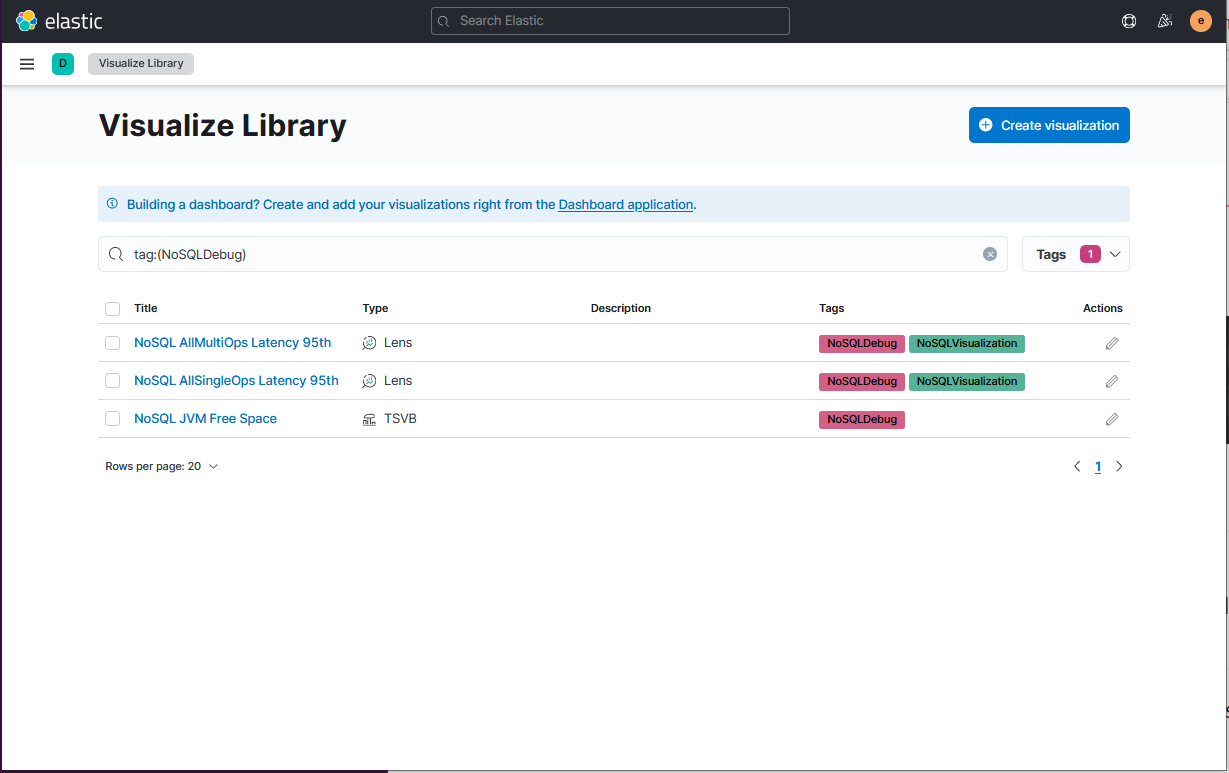
Description of the illustration kibanavisulazelibrary.png
By providing standard Kibana Visualization, you can add this information to your
Standard Application Performance Kibana dashboards. It allows you to do a
correlation between the application activity, the NoSQL performance and other OS
statistics collected (e.g CPU metrics collected using Metricbeat). 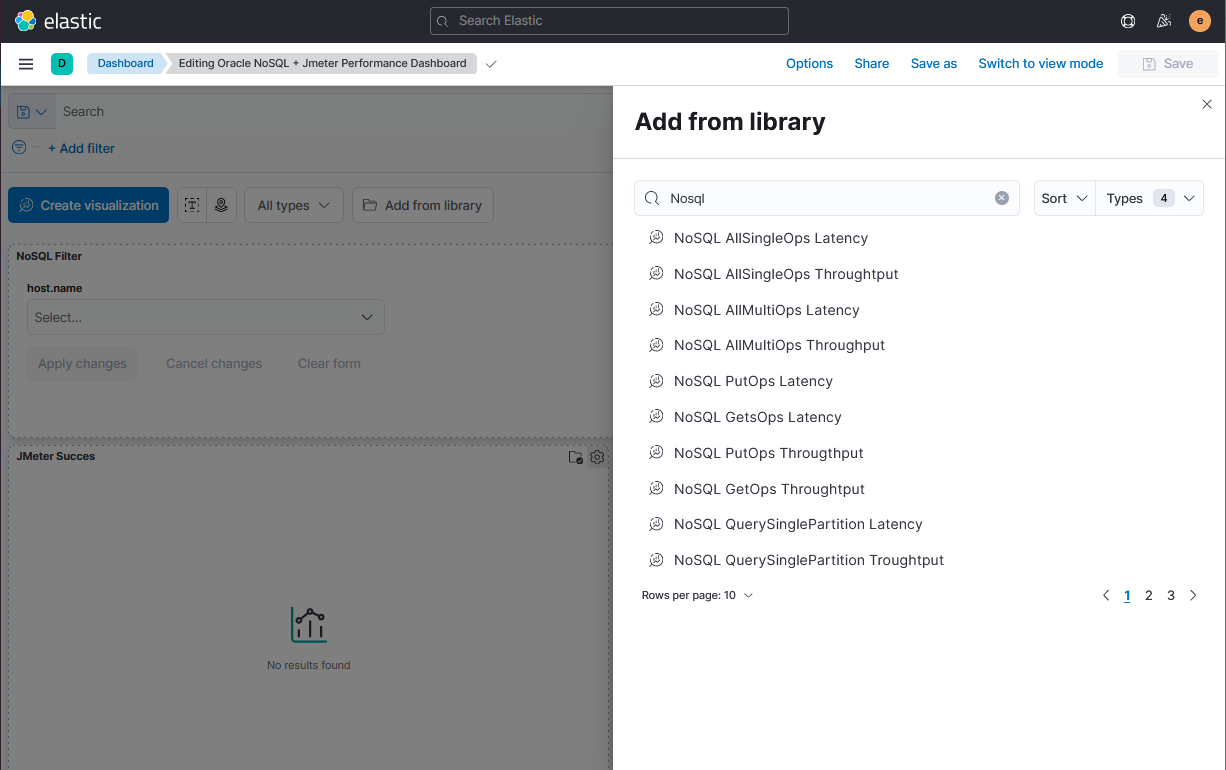
Description of the illustration kibanaaddvisulazation.png
The Oracle NoSQL + Jmeter Performance Dashboard is a good example of the
applications dashboards allowing these kind of correlations. The dashboard is used
to show how to do the correlation between Application Performance statistics
(provided by JMeter) and NoSQL standard performance metrics.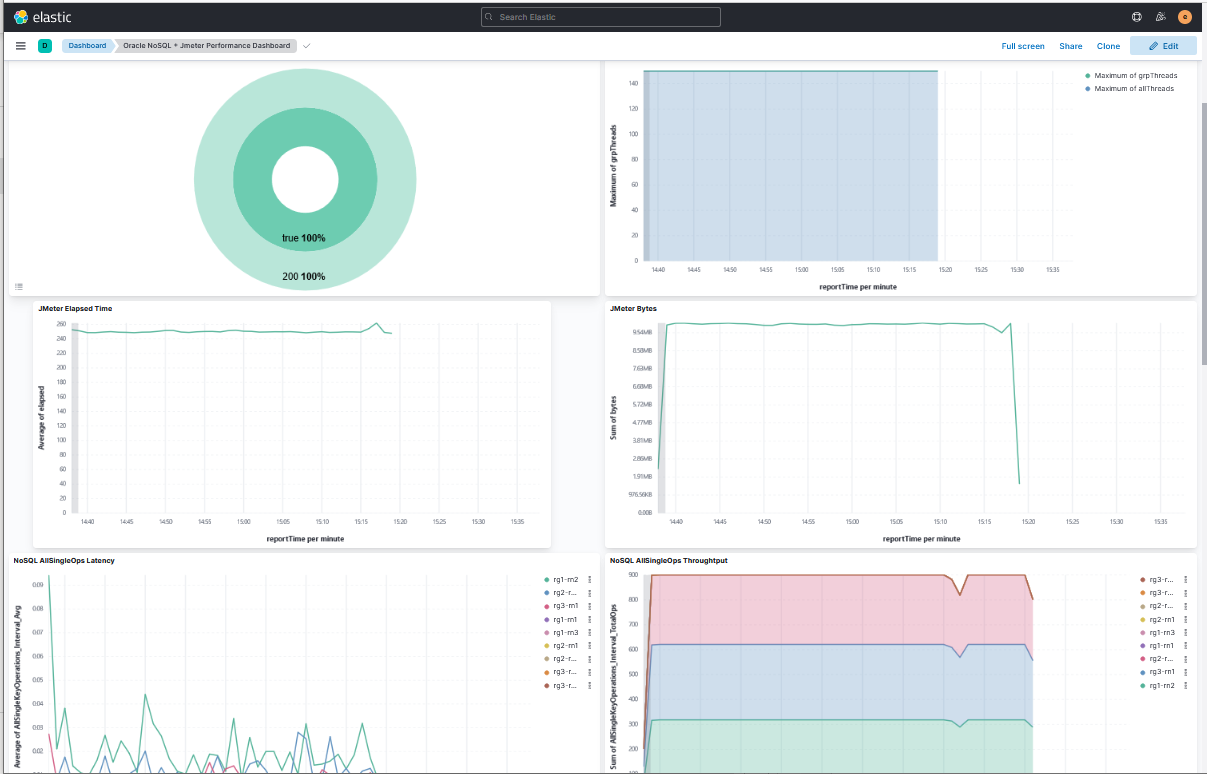
Description of the illustration kibanadashboardperfjmeter.png
