Access and Visualize Metrics
-
CSV Files:
Browse the
$KVROOT/<storename>/metricsdirectory on each Storage Node to review the collected metrics as CSV files. -
Monitoring (Prometheus):
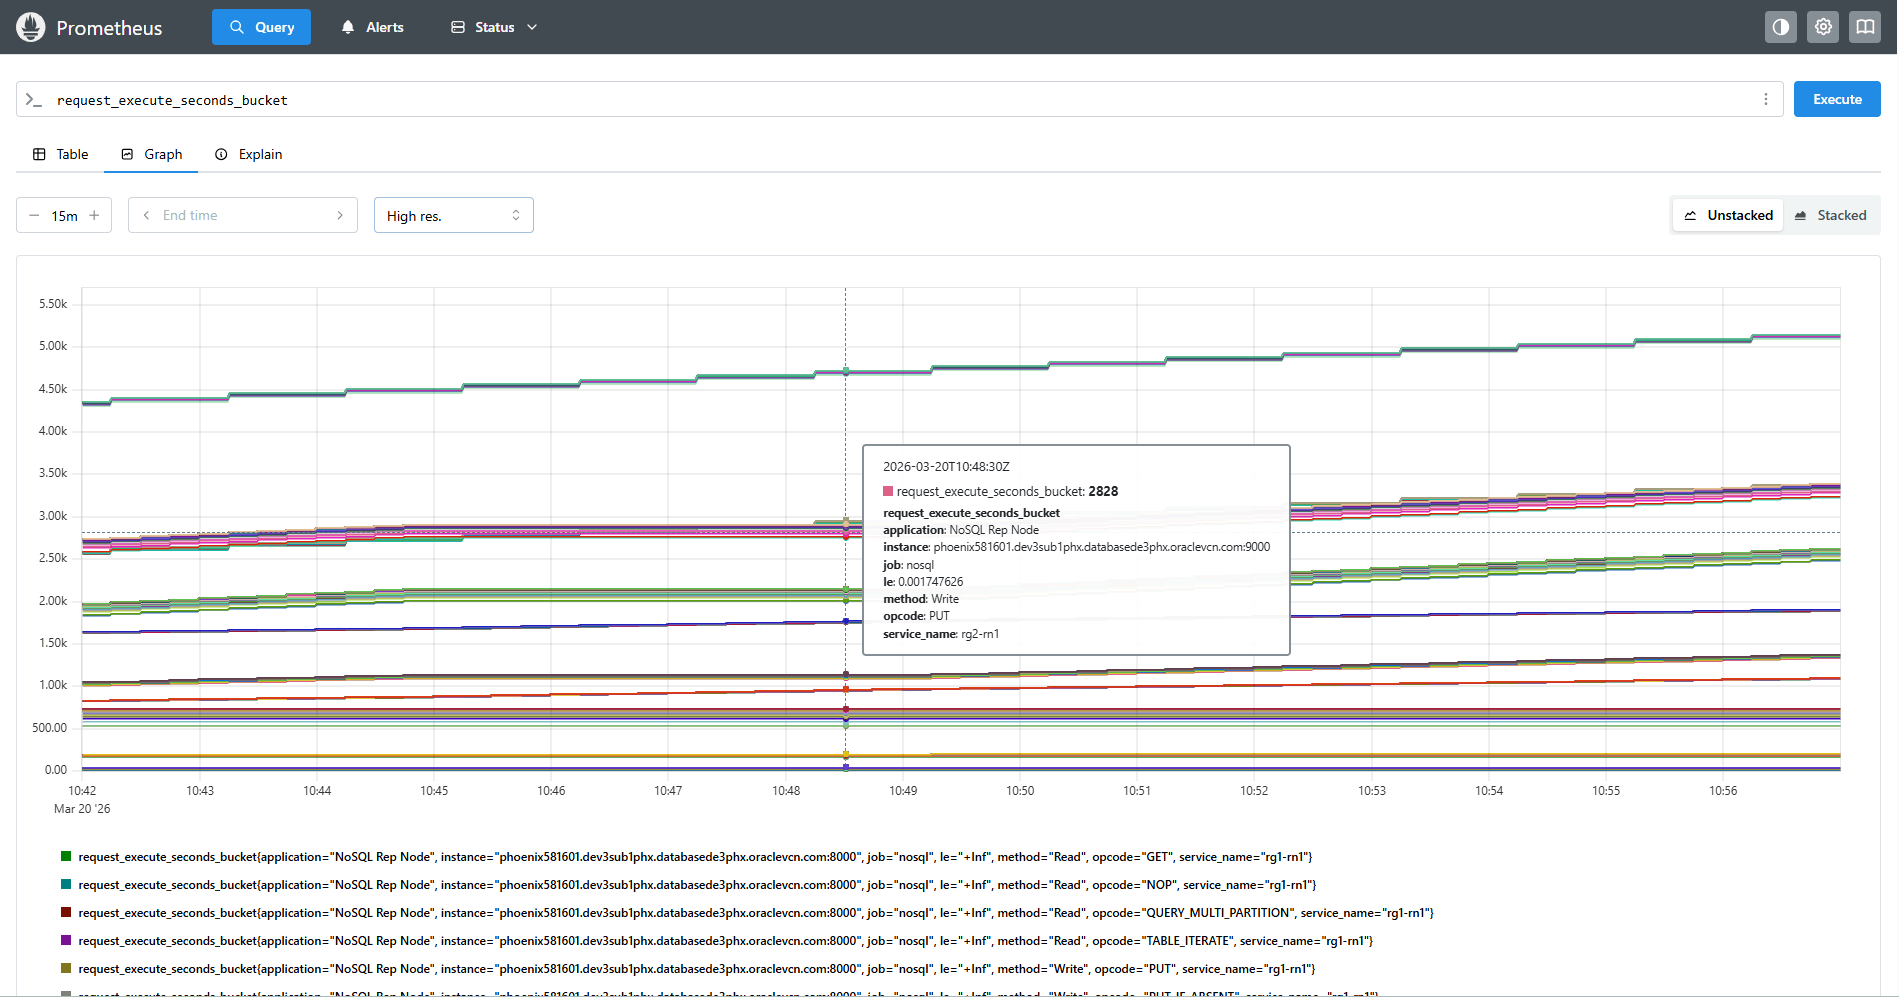
Once Prometheus is configured, view the metrics in the Prometheus UI. You can visualize real-time KVInsight metrics directly within Prometheus. A sample graphical view of the metrics is shown below:
Figure 1 - KVInsight Metrics in Prometheus
-
Visualization (Grafana):
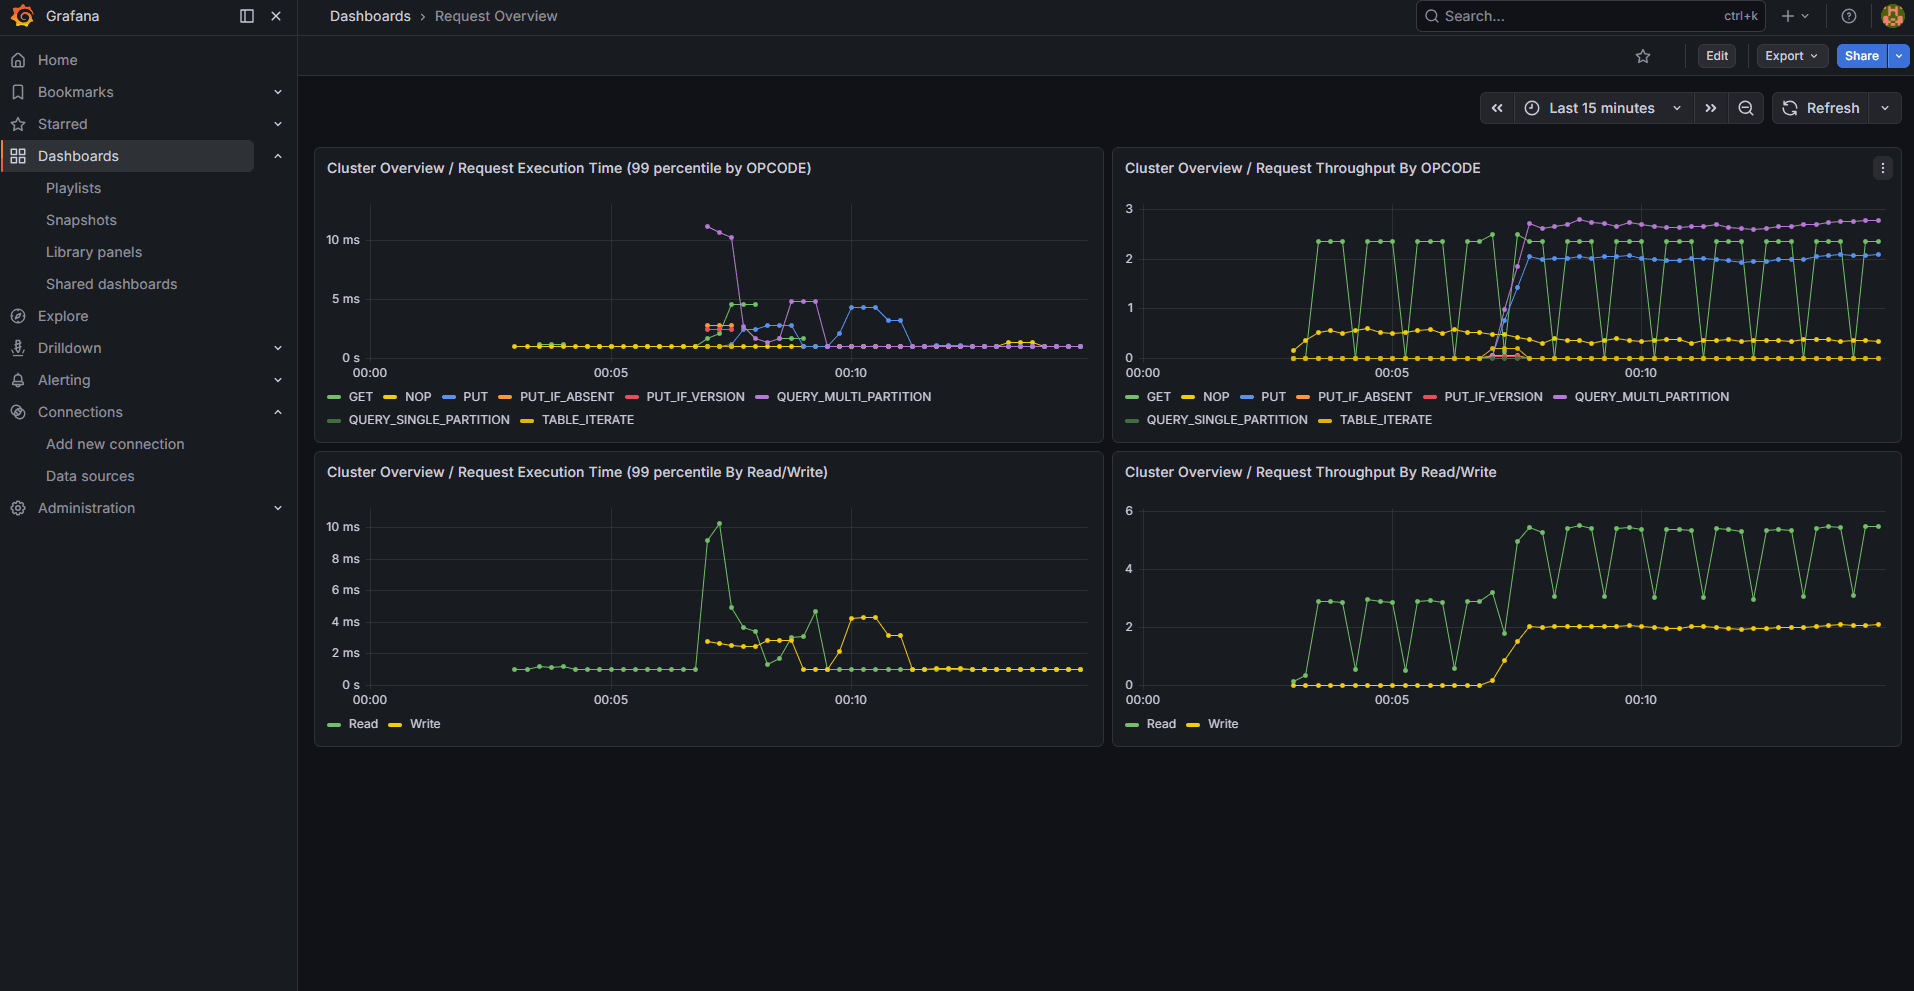
Once Prometheus is configured as a Grafana data source, view and visualize KVInsight metrics in Grafana. You can build custom dashboards or import a dashboard JSON to graph real-time KVInsight metrics from Prometheus. For more on Grafana, see Grafana Documentation. A sample dashboard is shown below:
Figure 2 - KVInsight Metrics Visualization in Grafana
-
Metric Reference:
For a quick reference of the data store metrics, see
$KVHOME/monitoring/metrics.html