2 Analytics
This chapter contains OGL Analytics knowledge articles.
Guide Report
Purpose:
See an overview of all your content.
Details and Orientation:
Each record provides the details for a specific guide.
The report provides the following information:
- meta data about the guide like the name
- aggregated information like the engagement grade of the guide
- engagement data for the guide like how many users completed it
Legend:
Below is a listing of all the columns in the report and their description.
Api Name:
A unique identifier for the guide.
Title:
The 'name' of the guide. This is the name you see in the dashboard as well as in the help widget.
Engagement Grade:
The number of times that the guide was engaged with divided by the number of times it was viewed.
Api Name:
A unique identifier for the guide.
Title:
The 'name' of the guide. This is the name you see in the dashboard as well as in the help widget.
Completion Grade:
The number of times that the guide was completed divided by the number of times it was viewed.
Last viewed:
When was the last time a user viewed this guide.
Last advanced:
When was the last time a user engaged this guide.
Last completed:
When was the last time a user completed this guide.
Guide Views:
The number of times the guide was viewed.
Guide Engagements:
The number of times the guide was engaged.
Guide Completions:
The number of times the guide was completed.
Guide Closes:
The number of times the guide was closed.
Unique User Views:
The number of unique users that viewed the guide.
Unique User Engagements:
The number of unique users that engaged the guide.
Unique User Completions:
The number of unique users that completed the guide.
Started from Help Widget:
The number of times the guides was started from help widget.
Started Automatically:
The number of times the guides was started automatically.
Started from Permalink:
The number of times the guides was started using the permalink.
Started from API:
The number of times the guides was started using Javascript API.
Started from another Guide:
The number of times the guides was started from another guide (e.g. branches).
OGL ANALYTICS
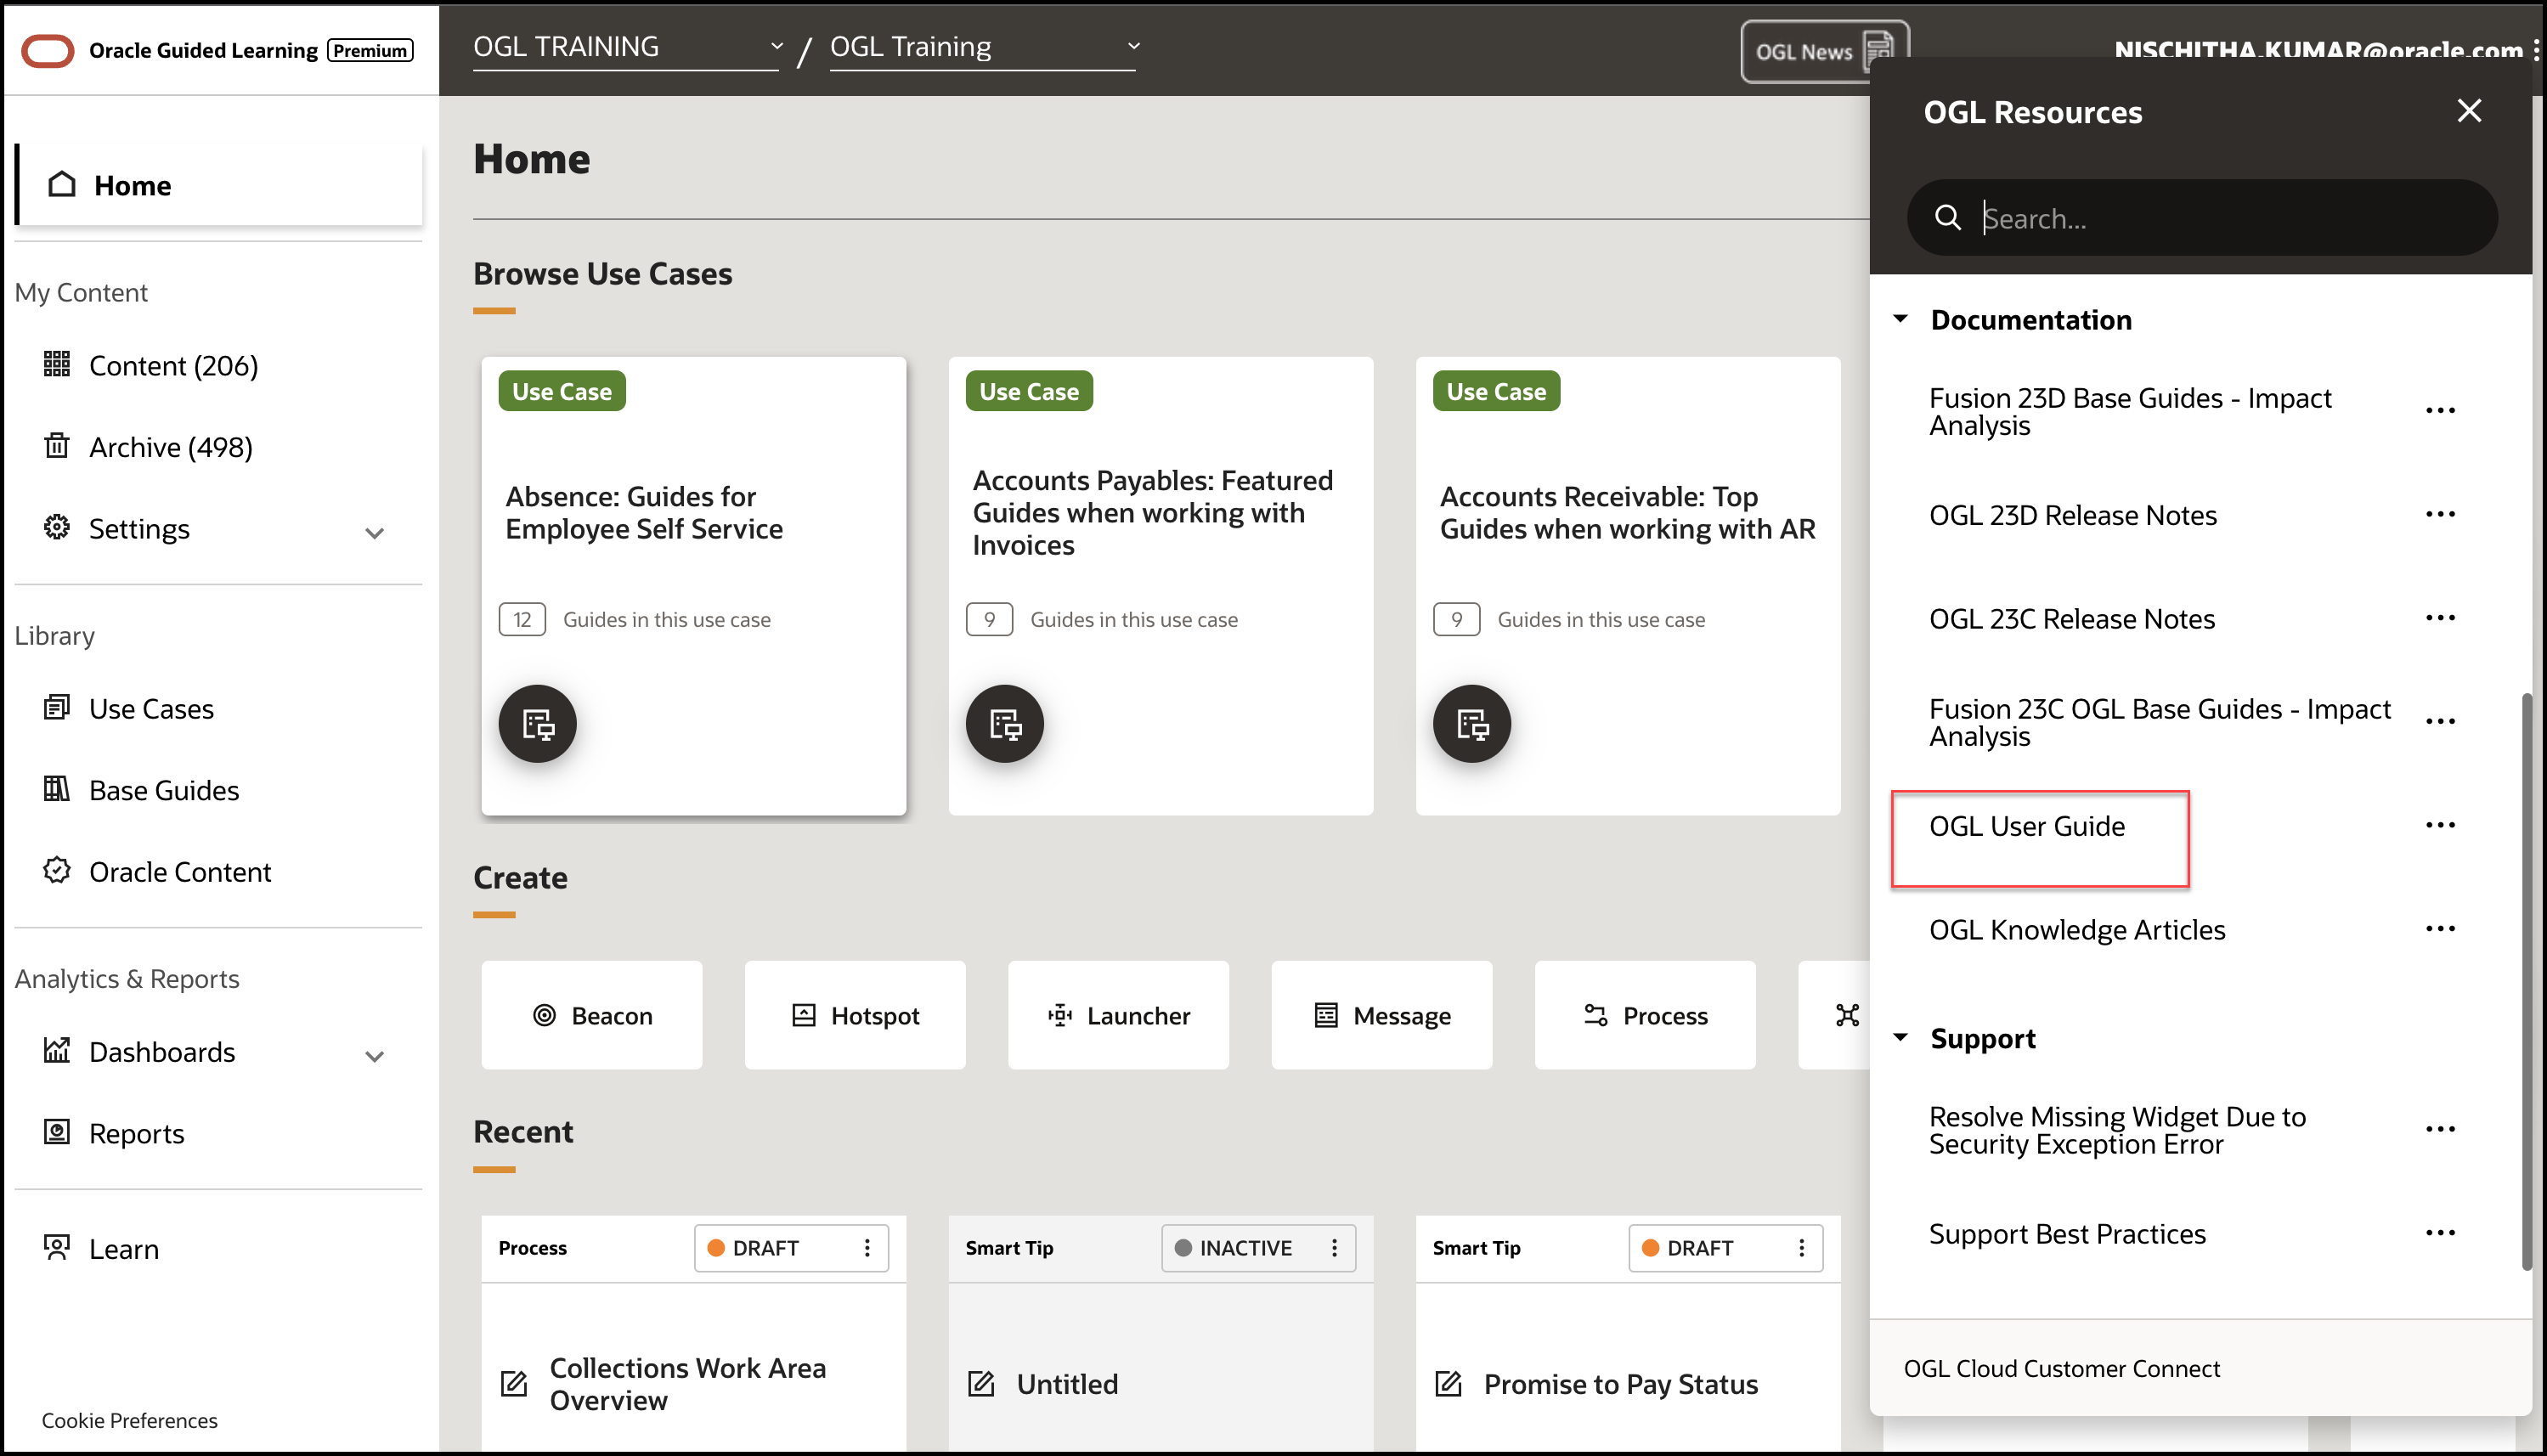
Please refer to the OGL User Guide for a detailed breakdown of unresolvable-reference.html#GUID-4A442E49-71F8-401E-BB71-560AAA62CAF8 , available from the Help Widget in the OGL console.

User Feedback
Guided Learning allows you to collect user feedback about the guides that you created.
With this feature enabled, whenever a user completes a guide or closes it in the middle a feedback widget like the one below will be displayed allowing the user to rate the experience and provide feedback.

In order to balance between your need to get as much feedback as possible from your users with not wanting to display the feedback widget too often thus affecting the user experience we have put in place two safety precautions:
- The feedback widget will never display twice for the same guide
- The feedback widget will never display more than once in 10 minutes. So if your user is running 3 guides within a 10 minute time frame s/he will only see the widget after the first guide.
Setup - Enabling User Feedback
- Open the Feedback link on the left side of your OGL Console under the Settings option.
- Set your parameters and save your settings. You can enable the Feedback in your dev or test instance before enabling it in Production

Analyzing the Feedback
Guided Learning collects all feedback and attaches it to both the relevant guide and the user who provided it.

The image above shows a visual representation of the feedback provided by the users.
Reports
You can download complete reports customized to meet your unique specifications.
Reports are accessed from the three dot ellipses at the top of each page:

Reports Types
There are 4 main types of Reports that can be downloaded:
- Guide
- User
- Feedback
- Bulk
| Guide | User | Feedback | Bulk |
|---|---|---|---|
 |
 |
 |
 |
|
Notes:
|
Note:
|
||
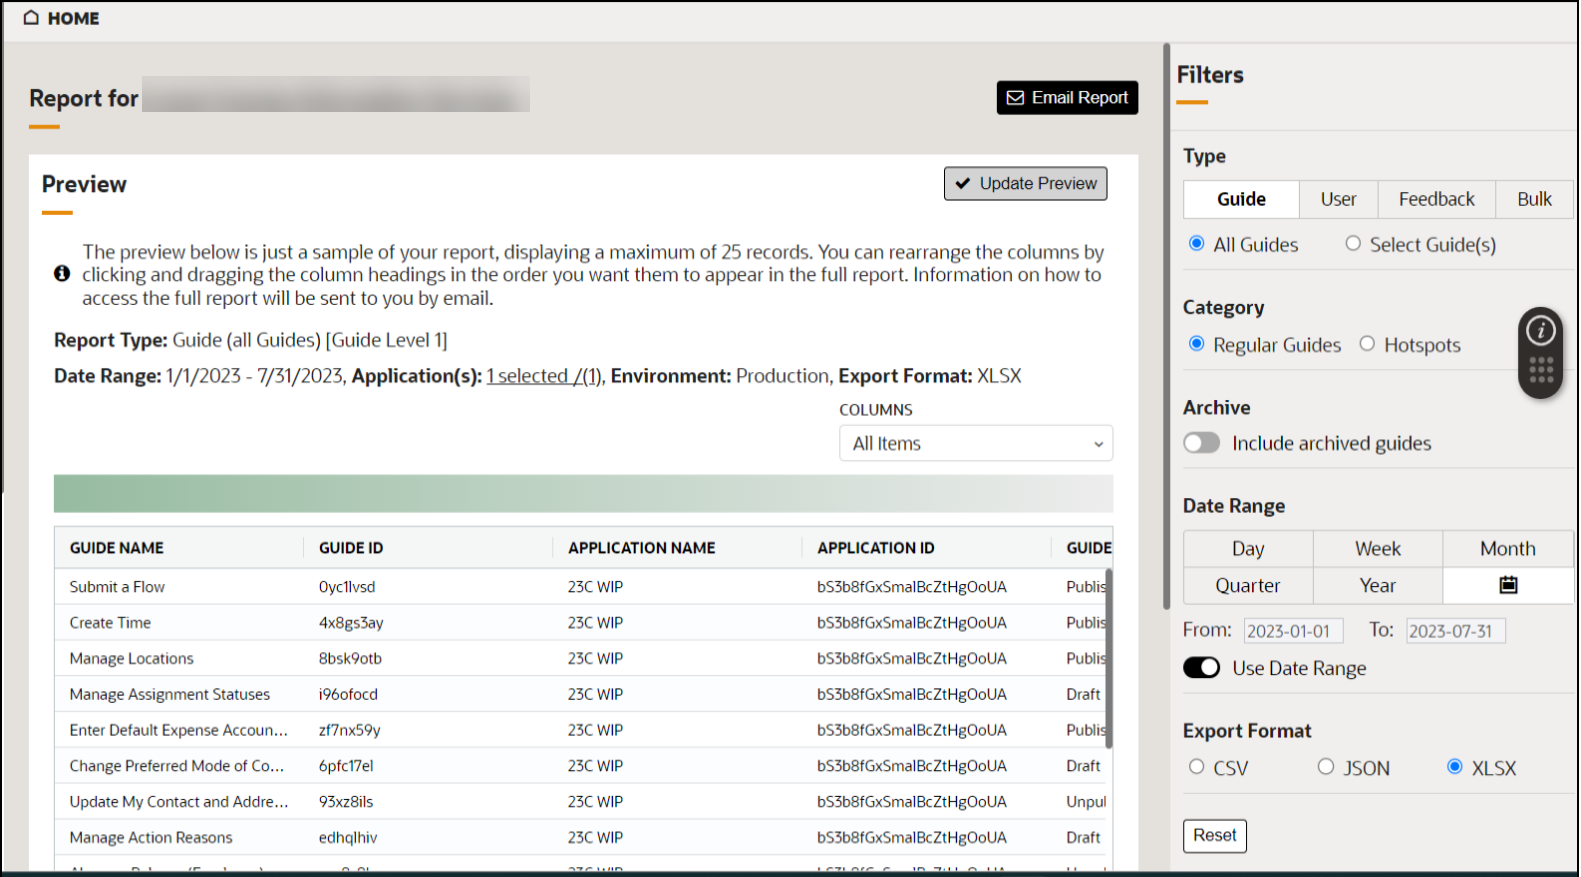
Once the options are selected, preview the data set by clicking on the Update Preview button in the main section of the window:


A summary of the criteria used for the report is presented above the preview table:
Select the Email Report button to request the required data report to be sent to your email address.