6.3.8.1 Monitoring I/O Resource Management (IORM) Using AWR
The AWR report includes information about the top databases running on the Exadata system. By using this information, you can monitor system-wide I/O resource consumption regardless of the database that hosts the AWR report. Additionally, the AWR report includes per-cell statistics, which enables you to easily determine if there is any skew in the I/O resource usage across the cells.
The AWR report includes:
-
Top Databases by IO Requests — provides statistics for the databases with the greatest number of I/O requests across all cells. It also breaks down the requests by device type (flash or disk) and by size (small or large).
-
Top Databases by Requests - Details — provides additional statistics regarding the I/O requests. Specifically, it shows the average latency and the average queue time for I/O requests. The queue time is the amount of time that an I/O requests spends in relevant I/O queue. Large queue times indicate that IORM is throttling the I/O.
-
Top Databases by IO Requests per Cell — provides statistics for the databases with the greatest number of I/O requests on each cell. It also breaks down the requests by device type (flash or disk) and by size (small or large). By using this information, you can easily determine if any cell behaves differently when servicing the I/O requests from the database(s).
-
Top Databases by IO Requests per Cell - Details — provides additional statistics regarding the I/O requests on each cell. Specifically, it shows the average latency and the average queue time for I/O requests on each cell. By using this information, you can easily determine if IORM behaves differently on any cell.
-
Top Databases by IO Throughput — provides statistics for the databases with the greatest I/O throughput across all cells. It also breaks down the throughput by device type (flash or disk) and by request size (small or large).
-
Top Databases by Throughput per Cell — provides statistics for the databases with the greatest I/O throughput on each cell. It also breaks down the throughput by device type (flash or disk) and by request size (small or large). By using this information, you can easily determine if any cell behaves differently when servicing the I/O from the database(s).
The AWR report may not be show information about all of the databases running on the Exadata system. Rather, it is designed to focus on the databases that are responsible for the majority of I/O on the storage servers. If more detailed information is required, then IORM cell metrics should be used.
For multitenant container databases (CDBs), the statistics in the AWR report include all of the I/Os associated with the database, including all of the pluggable databases (PDBs).
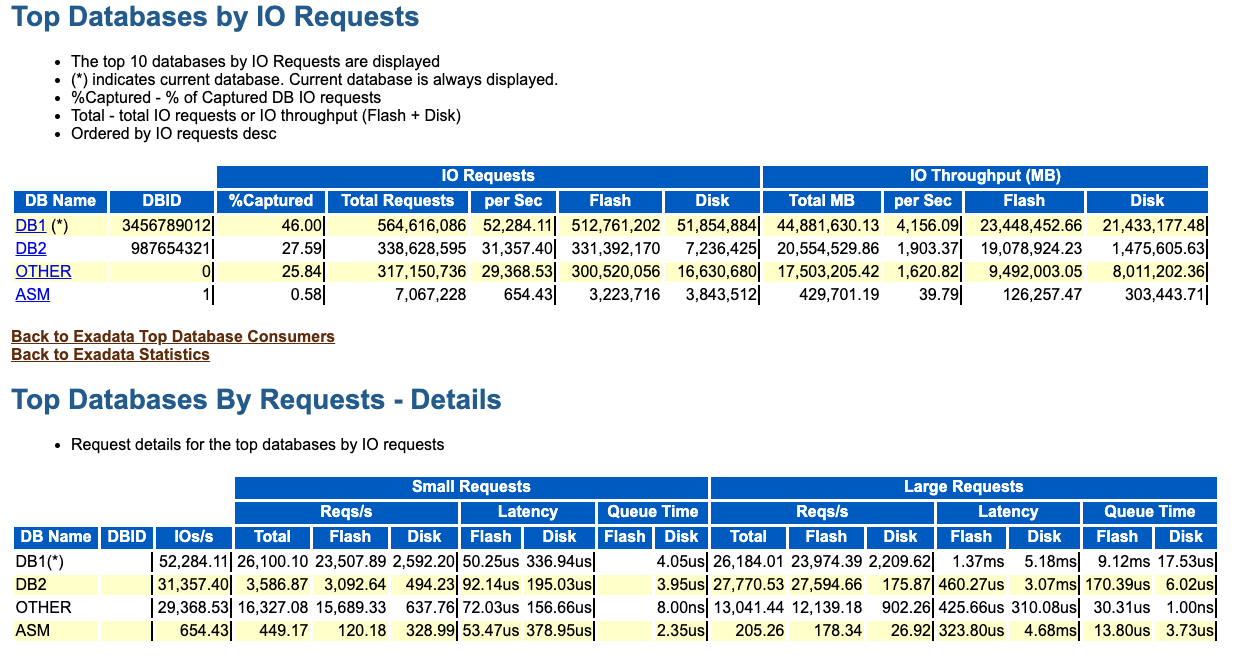
The following example shows the Top Databases by IO Requests and Top Databases by Requests - Details sections in the AWR report. The Top Databases by IO Requests section shows that the DB1 database generates 46% of the I/O requests captured in AWR. It also shows that approximately 10% of the I/O requests associated with the DB1 database are I/O requests to disk devices (51,854,884 disk I/O requests of the 564,616,086 total I/O requests). The Top Databases by Requests - Details section mostly shows minimal IORM wait time (queue time < 1 millisecond) across all databases. The exception is large I/O requests to flash for the DB1 database, which each have an average queue time of 9.12 milliseconds.
Figure 6-25 AWR Report: Top Databases by IO Requests

Parent topic: Monitoring I/O Resource Management (IORM)