6.3.7.3 Monitoring Smart I/O Using SQL Monitor
In addition to dynamic performance views and wait events, Oracle Database provides SQL monitor, which enables you to monitor the execution of individual SQL statements.
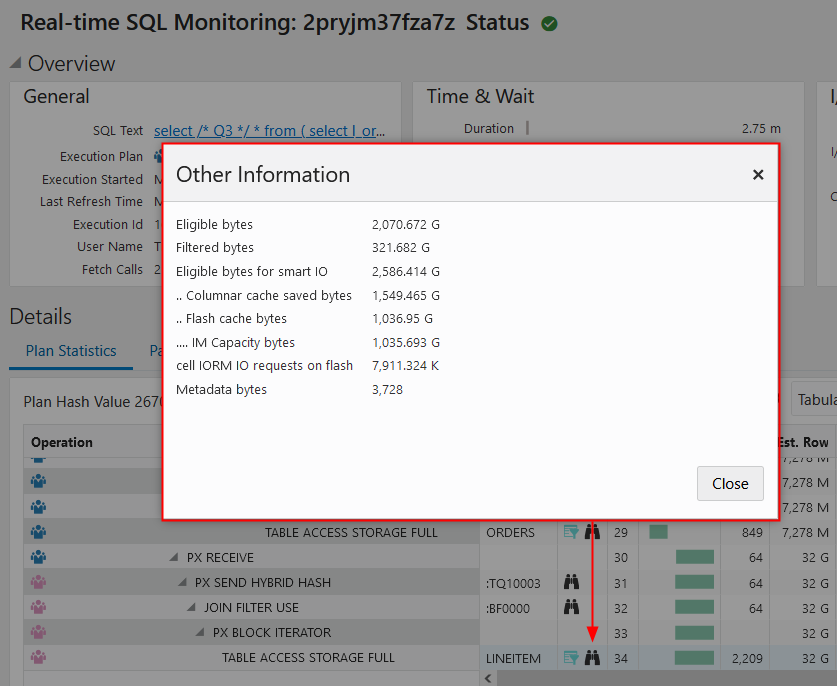
The SQL monitor report includes detailed statistics for the row sources, which includes additional information for smart I/O operations. The row source statistics can be viewed in the Enterprise Manager active SQL monitor report by clicking on the binoculars in the row source. For example:
Figure 6-24 SQL Monitor Report: Smart I/O Row Source Statistics

The following table describes various row source statistics provided by SQL monitor, which are useful for monitoring smart I/O.
| Statistic | Description |
|---|---|
Eligible bytes |
The number of bytes eligible for predicate offload based on the on-disk storage format. |
Filtered bytes |
The number of bytes returned by the cell. |
Eligible bytes for smart IO |
The actual number of bytes eligible for predicate offload. This value can differ from For example, with columnar cache, this value reflects the size of the data in the cache rather than on disk. If Exadata Hybrid Columnar Compression is used for on-disk storage, the on-disk size is typically smaller than the cached size. In other cases, the on-disk size is generally larger than the cached size. |
Cell passthru IO bytes |
The number of bytes that are not offloaded and sent back to the database for processing. |
Cell passthru IO bytes due to quarantine |
The number of bytes that are not offloaded and sent back to the database for processing due to a quarantine on the cell. |
SI saved bytes |
The number of bytes saved by storage index; that is, the number of bytes that did not have to be read. |
Columnar cache saved bytes |
The number of bytes saved by columnar cache; that is, the number of bytes that did not have to be read. |
Partial flash cache and disk bytes |
The total number of bytes for read requests that are partially fulfilled by Exadata Smart Flash Cache and partially by disk storage. |
Storage cache bytes |
The number of bytes read from either Exadata Smart Flash Cache or Exadata RDMA Memory Cache (XRMEM Cache). |
IM Capacity bytes |
The number of bytes read from the columnar cache in |
IM Query bytes |
The number of bytes read from the columnar cache in |
No memcompress bytes |
The number of bytes read from the columnar cache in |
XRMEM Columnar Cache bytes |
The number of bytes read from the columnar cache on Exadata RDMA Memory (XRMEM). |
Bytes added to storage index |
The number of bytes added to the storage index during a Smart Scan. This is an indication that the storage index is being built. |
cell IORM IO requests on flash |
The number of physical I/O requests to flash storage. |
cell IORM wait time on flash (us) |
The amount of time (in microseconds) IORM queued the flash request. Dividing |
cell IORM IO requests on disk |
The number of physical I/O requests to disk storage. |
cell IORM wait time on disk (us) |
The amount of time (in microseconds) IORM queued the disk request. Dividing |
Block IO bytes |
The number of bytes in block I/O mode. |
Cell reverse offload IO bytes |
The number of I/O bytes sent to the database server for processing due to high storage server CPU usage. |
|
|
The size of the query metadata sent from the database compute node to the cells. |
The availability of a specific statistic is subject to the version of Oracle Database being used.
Related Topics
Parent topic: Monitoring Smart I/O