7.8 Database Performance Tuning
For more information and videos, see https://blogs.oracle.com/database/post/database-performance-tuning.
Follow these step by step instructions to get started on your database performance tuning journey using Oracle Autonomous Health Framework.
Understanding Database Performance Tuning
Figure 7-38 Understanding Database Performance Tuning
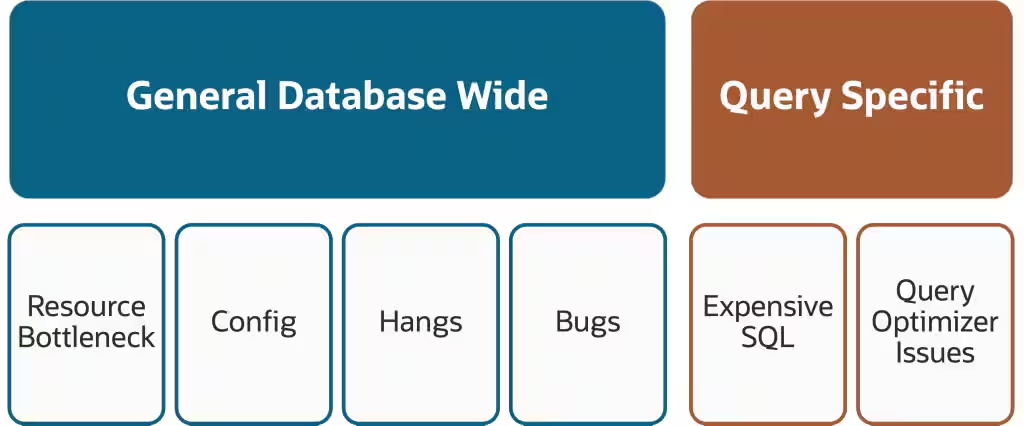
Common database performance issues fall into one of two categories. Either they are something affecting general database wide performance or they are query specific.
Database wide issues can be caused by:
- A bottleneck with some form of resource, such as CPU, IO, Memory, Network or processes
- A database misconfiguration of some type
- A database hang of some form
- Bugs
Query specific issues can be caused by:
- Expensive SQL, where the structure of the query forces it to take a long time
- Poor query optimization – This can be caused by things such as incorrect indexes, old statistics, and unexpected changes in execution plan, and so on.
Database Performance Tuning Steps
The basic Fix Flow steps for Database performance tuning are:
- Collect database performance diagnostics
- Use Autonomous Health Framework Insights
- Compare configuration against best practices
- Find and fix database anomalies and resource bottlenecks
- Use PerfHub report within Insights to identify and tune poor performing database workloads
- Understand and protect against noisy neighbors
- Log a new SR using the diagnostic collection
Use Autonomous Health Framework to collect database performance diagnostics
In the first step we’re going to use Autonomous Health Framework to generate a database performance diagnostic collection.
- Log into the machine where the database performance issue was seen and as the
Oracleuser run the command:tfactl diagcollect srdc –dbperf –database <database_name>Autonomous Health Framework will prompt if you have a performance issue now and then guide you through a series of questions and answers so it can collect all the necessary diagnostics.
For example:$ tfactl diagcollect -srdc dbperf -database db23cdb1 Do you have a performance issue now [Y|N] [Y]: Y Enter duration of the issue in hours [<RETURN>=1h]: 1h As you have indicated that the performance issue is currently happening, Performance Reports will be collected for the following periods: Start time when the performance was bad: 2024-05-01 15:13:32 Stop time when the performance was bad: 2024-05-01 16:13:32 For comparison, it is useful to gather data from another period with similar load where problems are not seen. Typically this is likely to be the same time period on a previous day. To compare to the same time period on a previous day enter the number of days ago you wish to use. [<RETURN> to provide other time range]: 1 Start time when the performance was good 2024-04-30 15:13:32 Stop time when the performance was good 2024-04-30 16:13:32 Has any SQL been identified to contribute to the performance issue?[Y|N]: N Do you wish to take an AWR Dump as part of this collection? [Y|N]: N Ending AWR snapshot successfully created. Found 3 snapshot(s) for Bad Performance time range in ORCL Found 3 snapshot(s) for baseline range in ORCL "Automatic Workload Repository (AWR) is a licensed feature. Refer to My Oracle Support Document ID 1490798.1 for more information" Components included in this collection: DATABASE CHMOS CHA OS INSIGHT Preparing to execute support diagnostic scripts. Executing DB Script srdc_db_lfsdiag.sql on db23cdb1 with timeout of 120 seconds... Executing DB Script srdc_real_time_addm.sql on db23cdb1 with timeout of 120 seconds... Executing DB Script srdc_statsadvisor_report.sql on db23cdb1 with timeout of 300 seconds... Executing DB Script collect_logon_logoff_triggers.sql on db23cdb1 with timeout of 300 seconds... Executing OS Script get_perfhub_report with timeout of 600 seconds... Collecting data for all nodes TFA is using system timezone for collection, All times shown in UTC. Scanning files from 2024-05-01 15:13:32 UTC to 2024-05-01 16:13:32 UTC Collection Id : 20240501161522machine1 Detailed Logging at : /u01/app/giusr/oracle.ahf/data/repository/srdc_dbperf_collection_Wed_May_01_16_15_27_UTC_2024_node_all/diagcollect_20240501161522_machine1.log Waiting up to 120 seconds for collection to start 2024/05/01 16:15:43 UTC : NOTE : Any file or directory name containing the string .com will be renamed to replace .com with dotcom 2024/05/01 16:15:43 UTC : Collection Name : tfa_srdc_dbperf_Wed_May_01_16_15_26_UTC_2024.zip 2024/05/01 16:15:43 UTC : Collecting diagnostics from hosts : [machine1, machine3, machine2, machine4] 2024/05/01 16:15:45 UTC : Getting list of files satisfying time range [05/01/2024 15:13:32, 05/01/2024 16:13:32] 2024/05/01 16:15:45 UTC : Collecting Additional Diagnostic Information... 2024/05/01 16:16:48 UTC : Executing DB Script awr_reports on db23cdb1 with timeout of 3600 seconds... 2024/05/01 16:16:57 UTC : Completed Collection of Additional Diagnostic Information for Insights... 2024/05/01 16:18:56 UTC : Collecting ADR incident files... 2024/05/01 16:20:32 UTC : Executing Applicable ORAchk Validations with timeout of 600 seconds... 2024/05/01 16:24:16 UTC : Executing IPS Incident Package Collection(s)... 2024/05/01 16:24:25 UTC : No ADR Incidents for db23cdb1 covering period "2024-05-01 15:13:32" to "2024-05-01 16:13:32" were generated, IPS Pack will not be collected. 2024/05/01 16:24:25 UTC : Executing SQL Script db_feature_usage.sql on db23cdb1 with timeout of 600 seconds... 2024/05/01 16:24:25 UTC : Executing Collection for OS with timeout of 1800 seconds... 2024/05/01 16:24:39 UTC : Completed Collection of Additional Diagnostic Information... 2024/05/01 16:24:47 UTC : Completed Local Collection 2024/05/01 16:24:47 UTC : Not Redacting this Collection ... 2024/05/01 16:24:47 UTC : Remote Collection in Progress... 2024/05/01 16:24:48 UTC : Collection completed on host: machine2 2024/05/01 16:24:48 UTC : Collection completed on host: machine3 2024/05/01 16:24:48 UTC : Collection completed on host: machine4 2024/05/01 16:24:52 UTC : Executing Creation of insights zip with timeout of 900 seconds... 2024/05/01 16:28:49 UTC : Report is generated at : /u01/app/giusr/oracle.ahf/data/repository/srdc_dbperf_collection_Wed_May_01_16_15_27_UTC_2024_node_all/machine1_insights_2024_05_01_16_24_55.zip 2024/05/01 16:28:49 UTC : Finished creation of insights zip with status 0 2024/05/01 16:28:50 UTC : Collection completed on host: machine1 2024/05/01 16:28:49 UTC : Completed collection of zip files. .-----------------------------------------. | Collection Summary | +---------------+-----------+------+------+ | Host | Status | Size | Time | +---------------+-----------+------+------+ | machine2 | Completed | 13MB | 289s | | machine3 | Completed | 12MB | 332s | | machine4 | Completed | 13MB | 420s | | machine1 | Completed | 17MB | 544s | '---------------+-----------+------+------' Logs are being collected to: /u01/app/giusr/oracle.ahf/data/repository/srdc_dbperf_collection_Wed_May_01_16_15_27_UTC_2024_node_all /u01/app/giusr/oracle.ahf/data/repository/srdc_dbperf_collection_Wed_May_01_16_15_27_UTC_2024_node_all/machine1.tfa_srdc_dbperf_Wed_May_01_16_15_26_UTC_2024.zip /u01/app/giusr/oracle.ahf/data/repository/srdc_dbperf_collection_Wed_May_01_16_15_27_UTC_2024_node_all/machine2.tfa_srdc_dbperf_Wed_May_01_16_15_26_UTC_2024.zip /u01/app/giusr/oracle.ahf/data/repository/srdc_dbperf_collection_Wed_May_01_16_15_27_UTC_2024_node_all/machine3.tfa_srdc_dbperf_Wed_May_01_16_15_26_UTC_2024.zip /u01/app/giusr/oracle.ahf/data/repository/srdc_dbperf_collection_Wed_May_01_16_15_27_UTC_2024_node_all/machine4.tfa_srdc_dbperf_Wed_May_01_16_15_26_UTC_2024.zip /u01/app/giusr/oracle.ahf/data/repository/srdc_dbperf_collection_Wed_May_01_16_15_27_UTC_2024_node_all/machine1_insights_2024_05_01_16_24_55.zipOnce it’s finished AHF will package everything for you in a zip file for each machine, as you progress you'll only need the one from the node where the problem occurred.
Now we can move on to step number two. Use Autonomous Health Framework Insights to find recommendations.
Use Autonomous Health Framework Insights
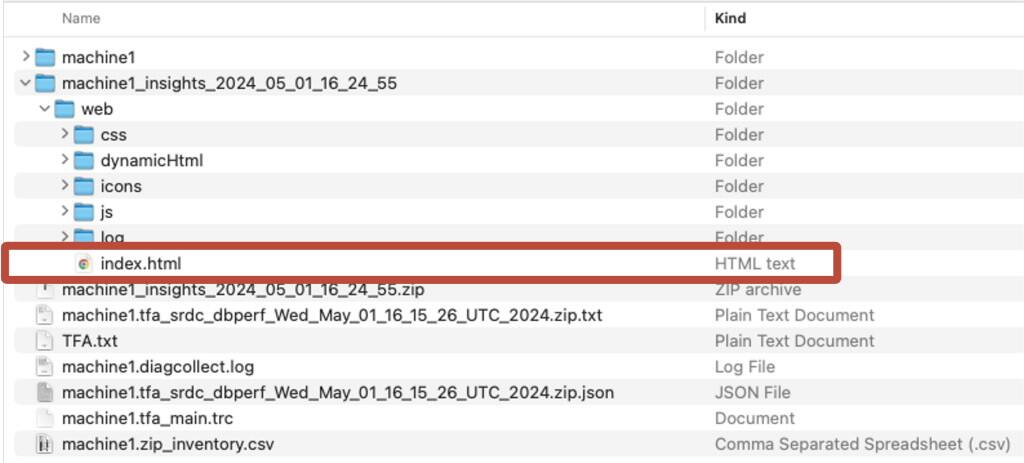
Transfer the diagnostic zip from the machine where you initiated the collection to a machine with a web browser and unzip it.
Figure 7-39 AHF Insights

Within here you’ll find another zip containing Autonomous Health Framework Insights. Extract that and open the index.html.
Figure 7-40 AHF Insights
- Compare configuration against best practices
Autonomous Health Framework Insights provides you a bird's eye view of your entire system. You can use it to spot problems, drill into the root cause and understand how to resolve.
First, we’ll look for any relevant configuration problems to see if you’ve drifted from Oracle best practices.
Click on the Best Practices issues to drill down.
Figure 7-41 AHF Insights
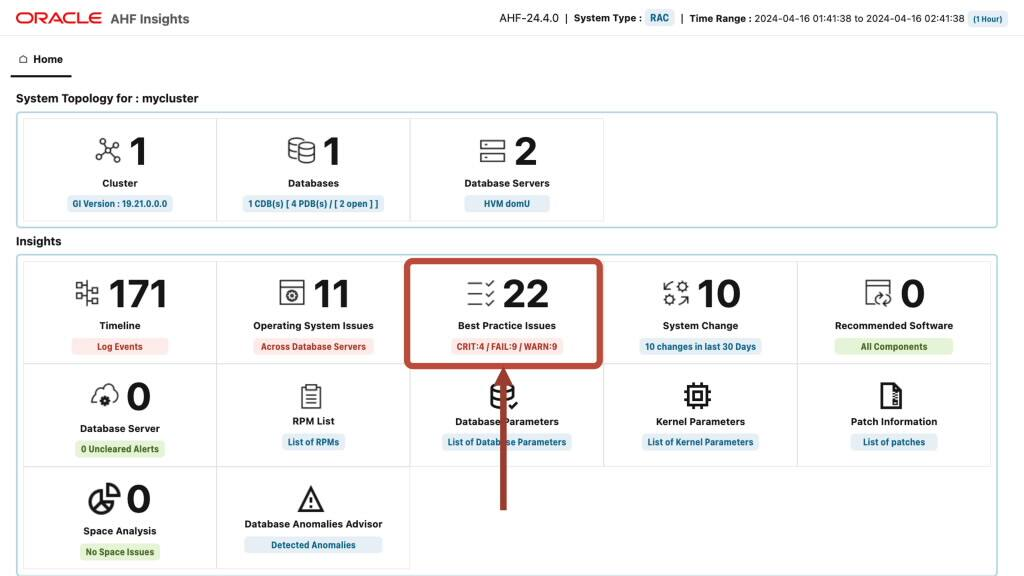
The summary provides an overview of where your system has strayed from best practice and the relative severity.
Figure 7-42 AHF Insights
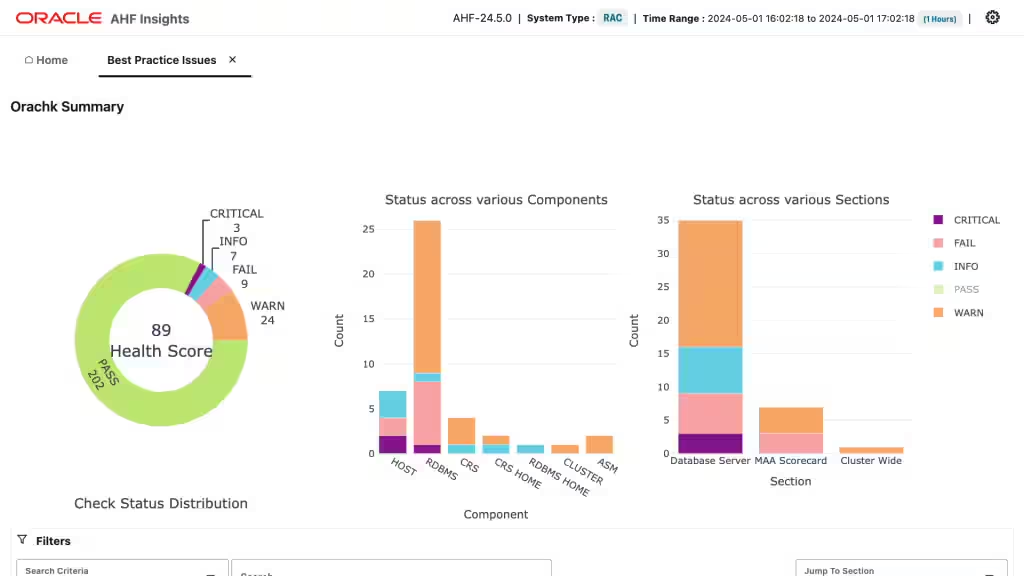
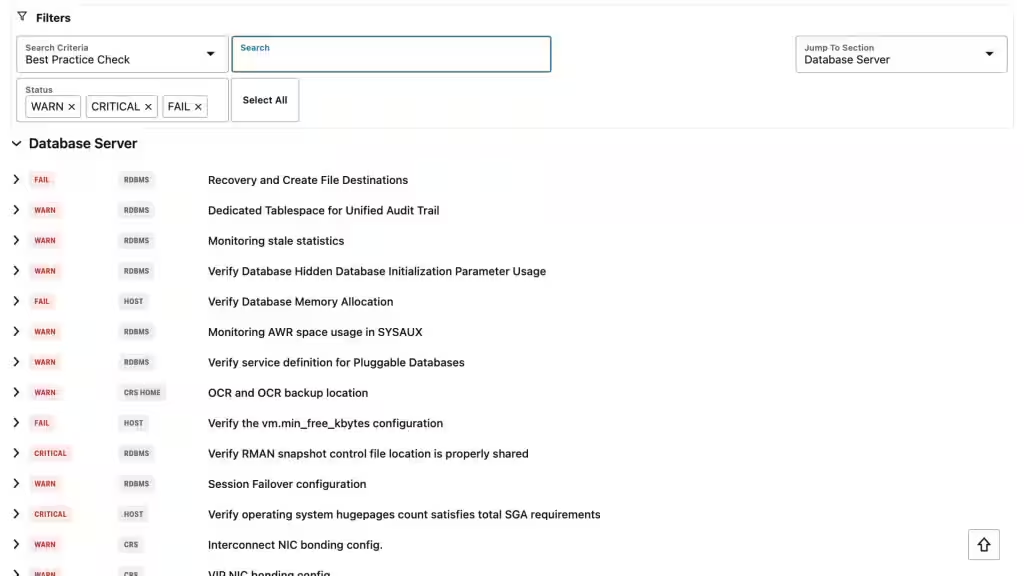
As you scroll down you’ll see specific configuration issues. Look down through the list of issues and see if you find anything that may be relevant. If you find something that looks like it could be related to performance, expand it to see the recommendation. Every best practice check explains the impact and risk of this configuration drift along with the repair steps.
Figure 7-43 AHF Insights
- Find and fix database anomalies and resource bottlenecks
Next, we’ll look at the Database Anomalies Advisor.
Autonomous Health Framework uses AI to detect unusual events and recommend solutions.
Figure 7-44 AHF Insights
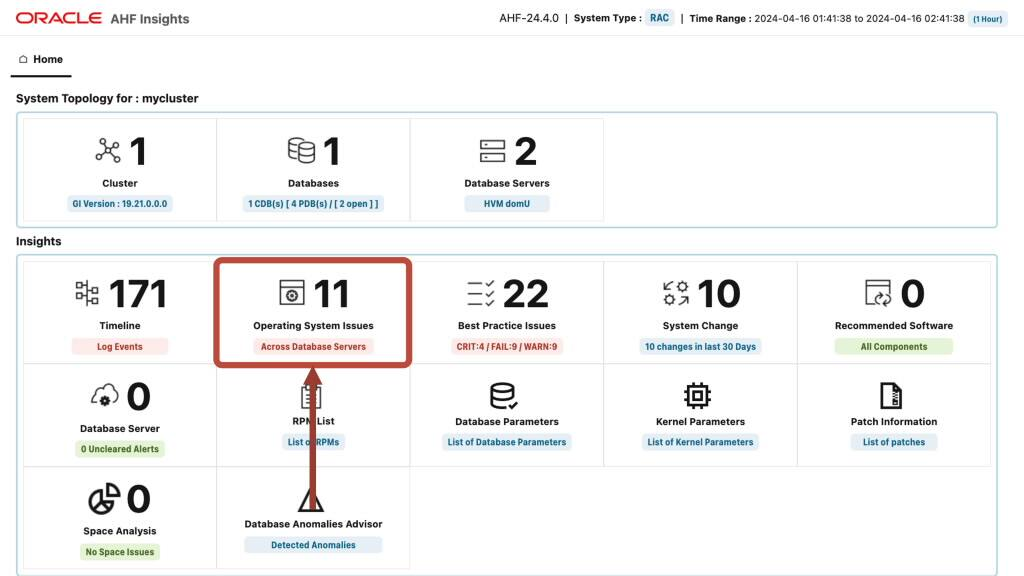
In this scenario Autonomous Health Framework has detected a number of unusual events suggesting the database and host IO is slow.
Figure 7-45 AHF Insights
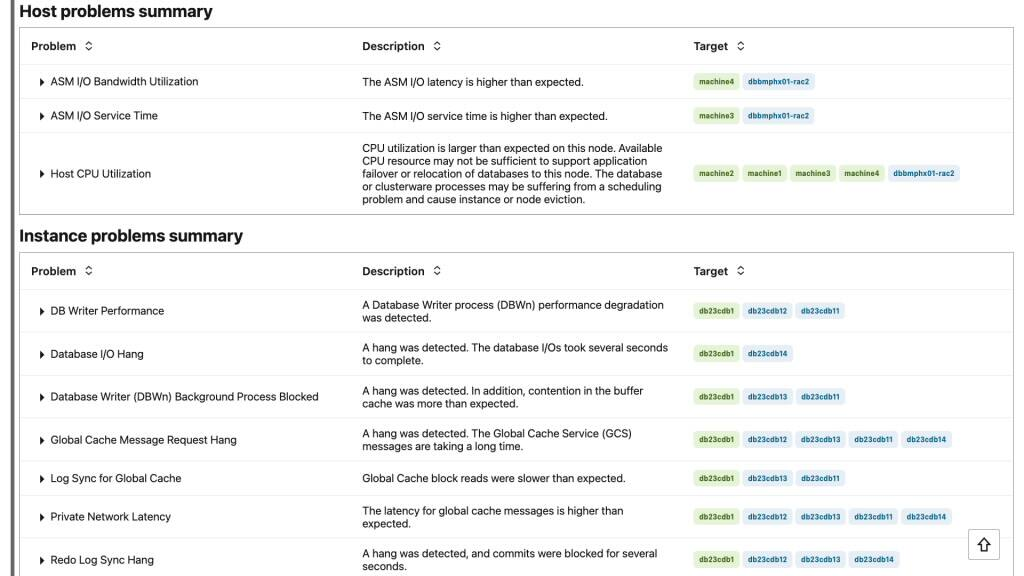
From here we can go back out to the home screen to explore the Operating System metrics.
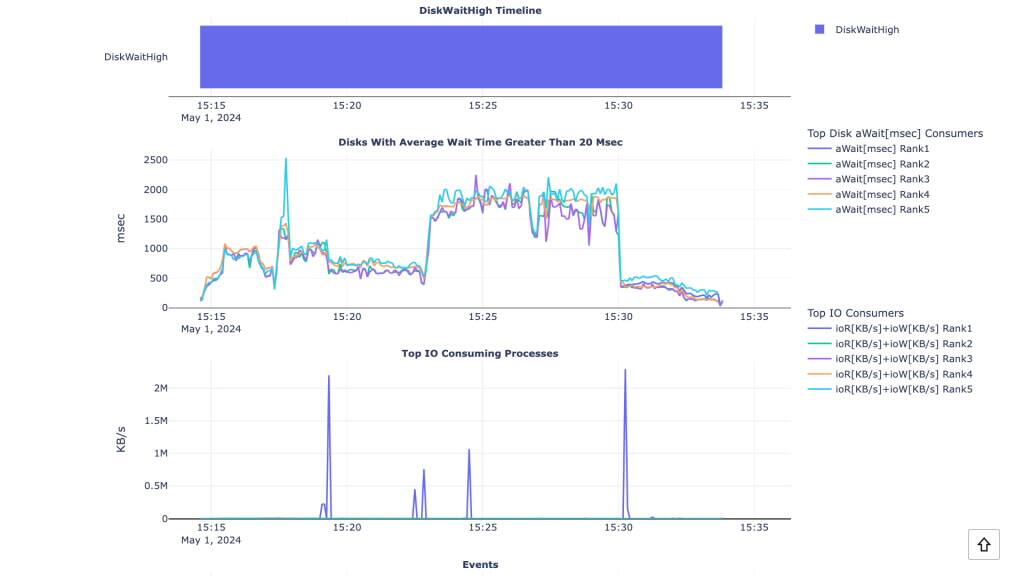
In this example we can see Autonomous Health Framework has detected the Oracle Processes were blocked in D State, which means they were stuck waiting for IO to return. We can also see some disks had a long wait time.
Figure 7-46 AHF Insights
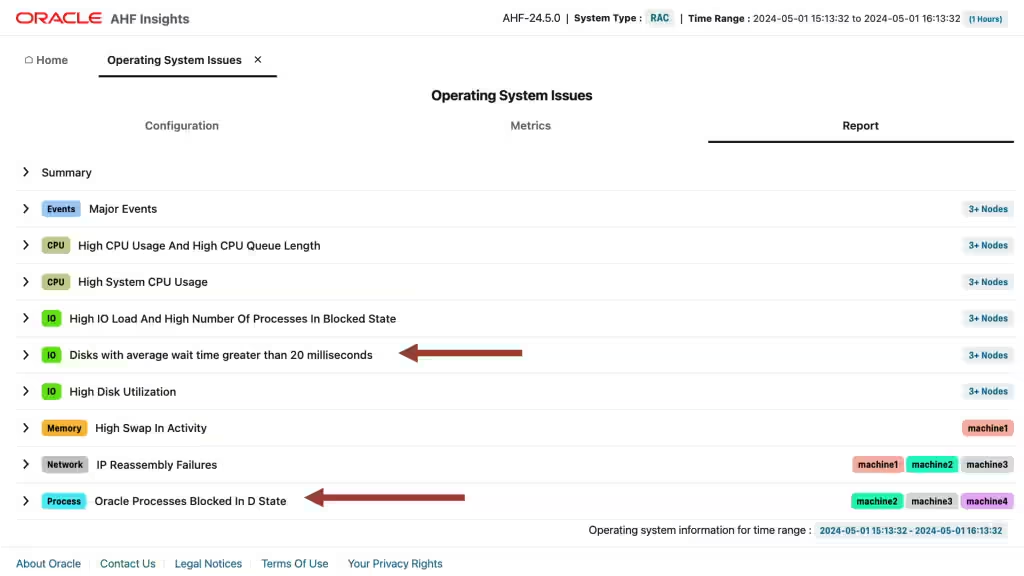
Expanding this gives us graphs showing disks with average wait time greater than 20 milliseconds and top IO consuming processes.
Figure 7-47 AHF Insights
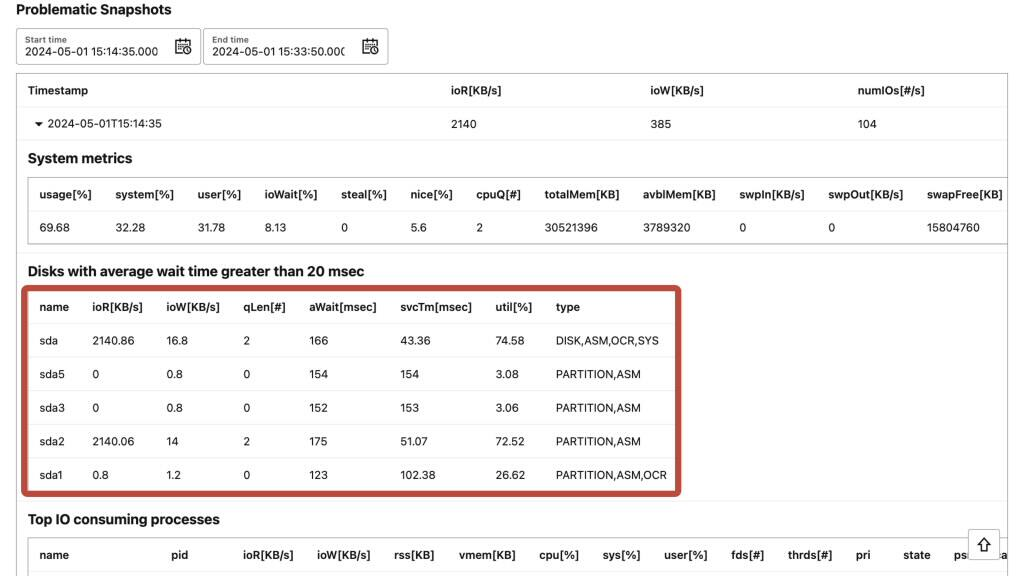
And scrolling further down we can see problematic snapshots. This one shows us which disks were slow.
Figure 7-48 AHF Insights
High CPU Usage Example Scenario
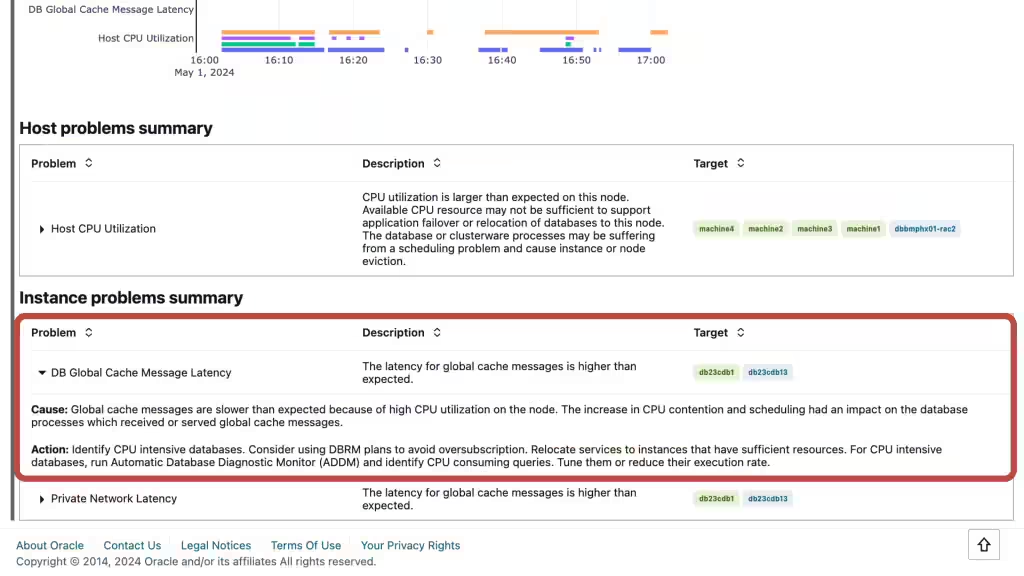
Here’s a different scenario looking at anomalies detected by Autonomous Health Framework, in this case we see the latency for Database global cache messages higher than expected. Autonomous Health Framework tells us the cause and recommended action.
So now we know CPU is a bottleneck.
Figure 7-49 AHF Insights
Going to the OS issues report page in this scenario shows us a finding for high CPU usage. Expanding that finding shows us details about when the CPU usage was high. As we scroll down we see CPU usage graphed over time.
Figure 7-50 AHF Insights
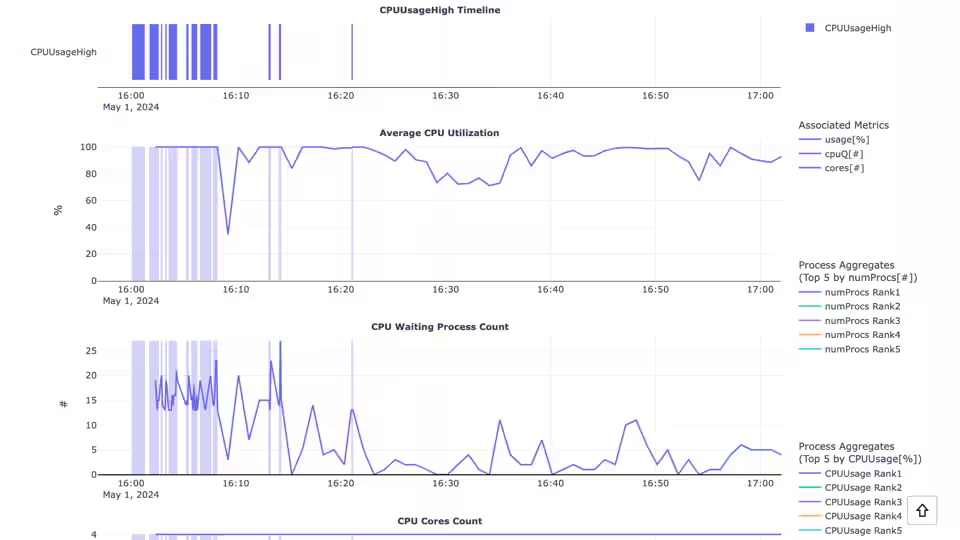
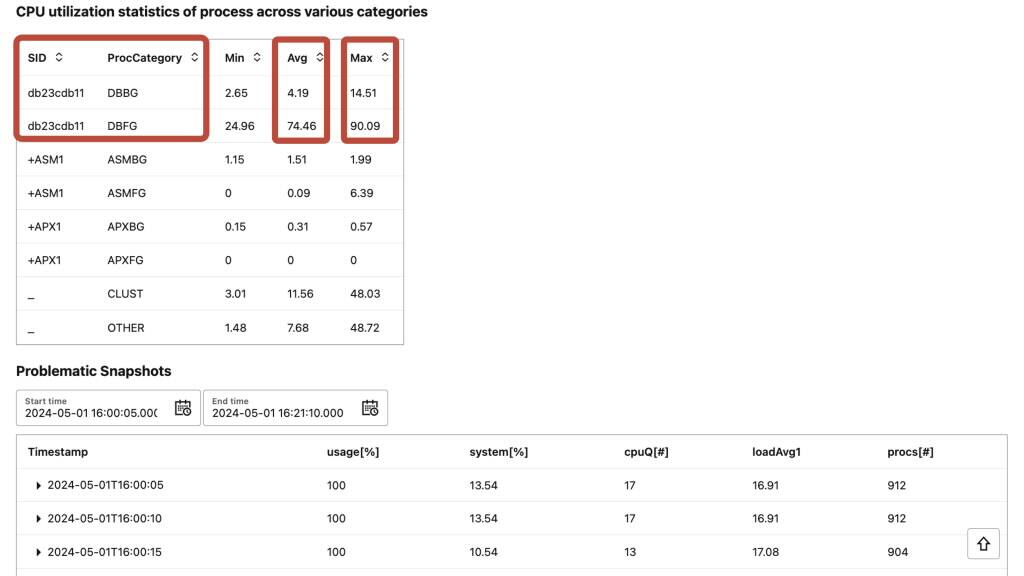
Continuing down shows us the CPU usage for different processes. Here we can see the database background and foreground processes are consuming an average of over 80% CPU and a Max of over 100% CPU.
Figure 7-51 AHF Insights
- Use PerfHub report within Insights to identify and tune poor performing database workloads
AHF embeds the most useful performance tuning reports, directly within the AHF Insights report.
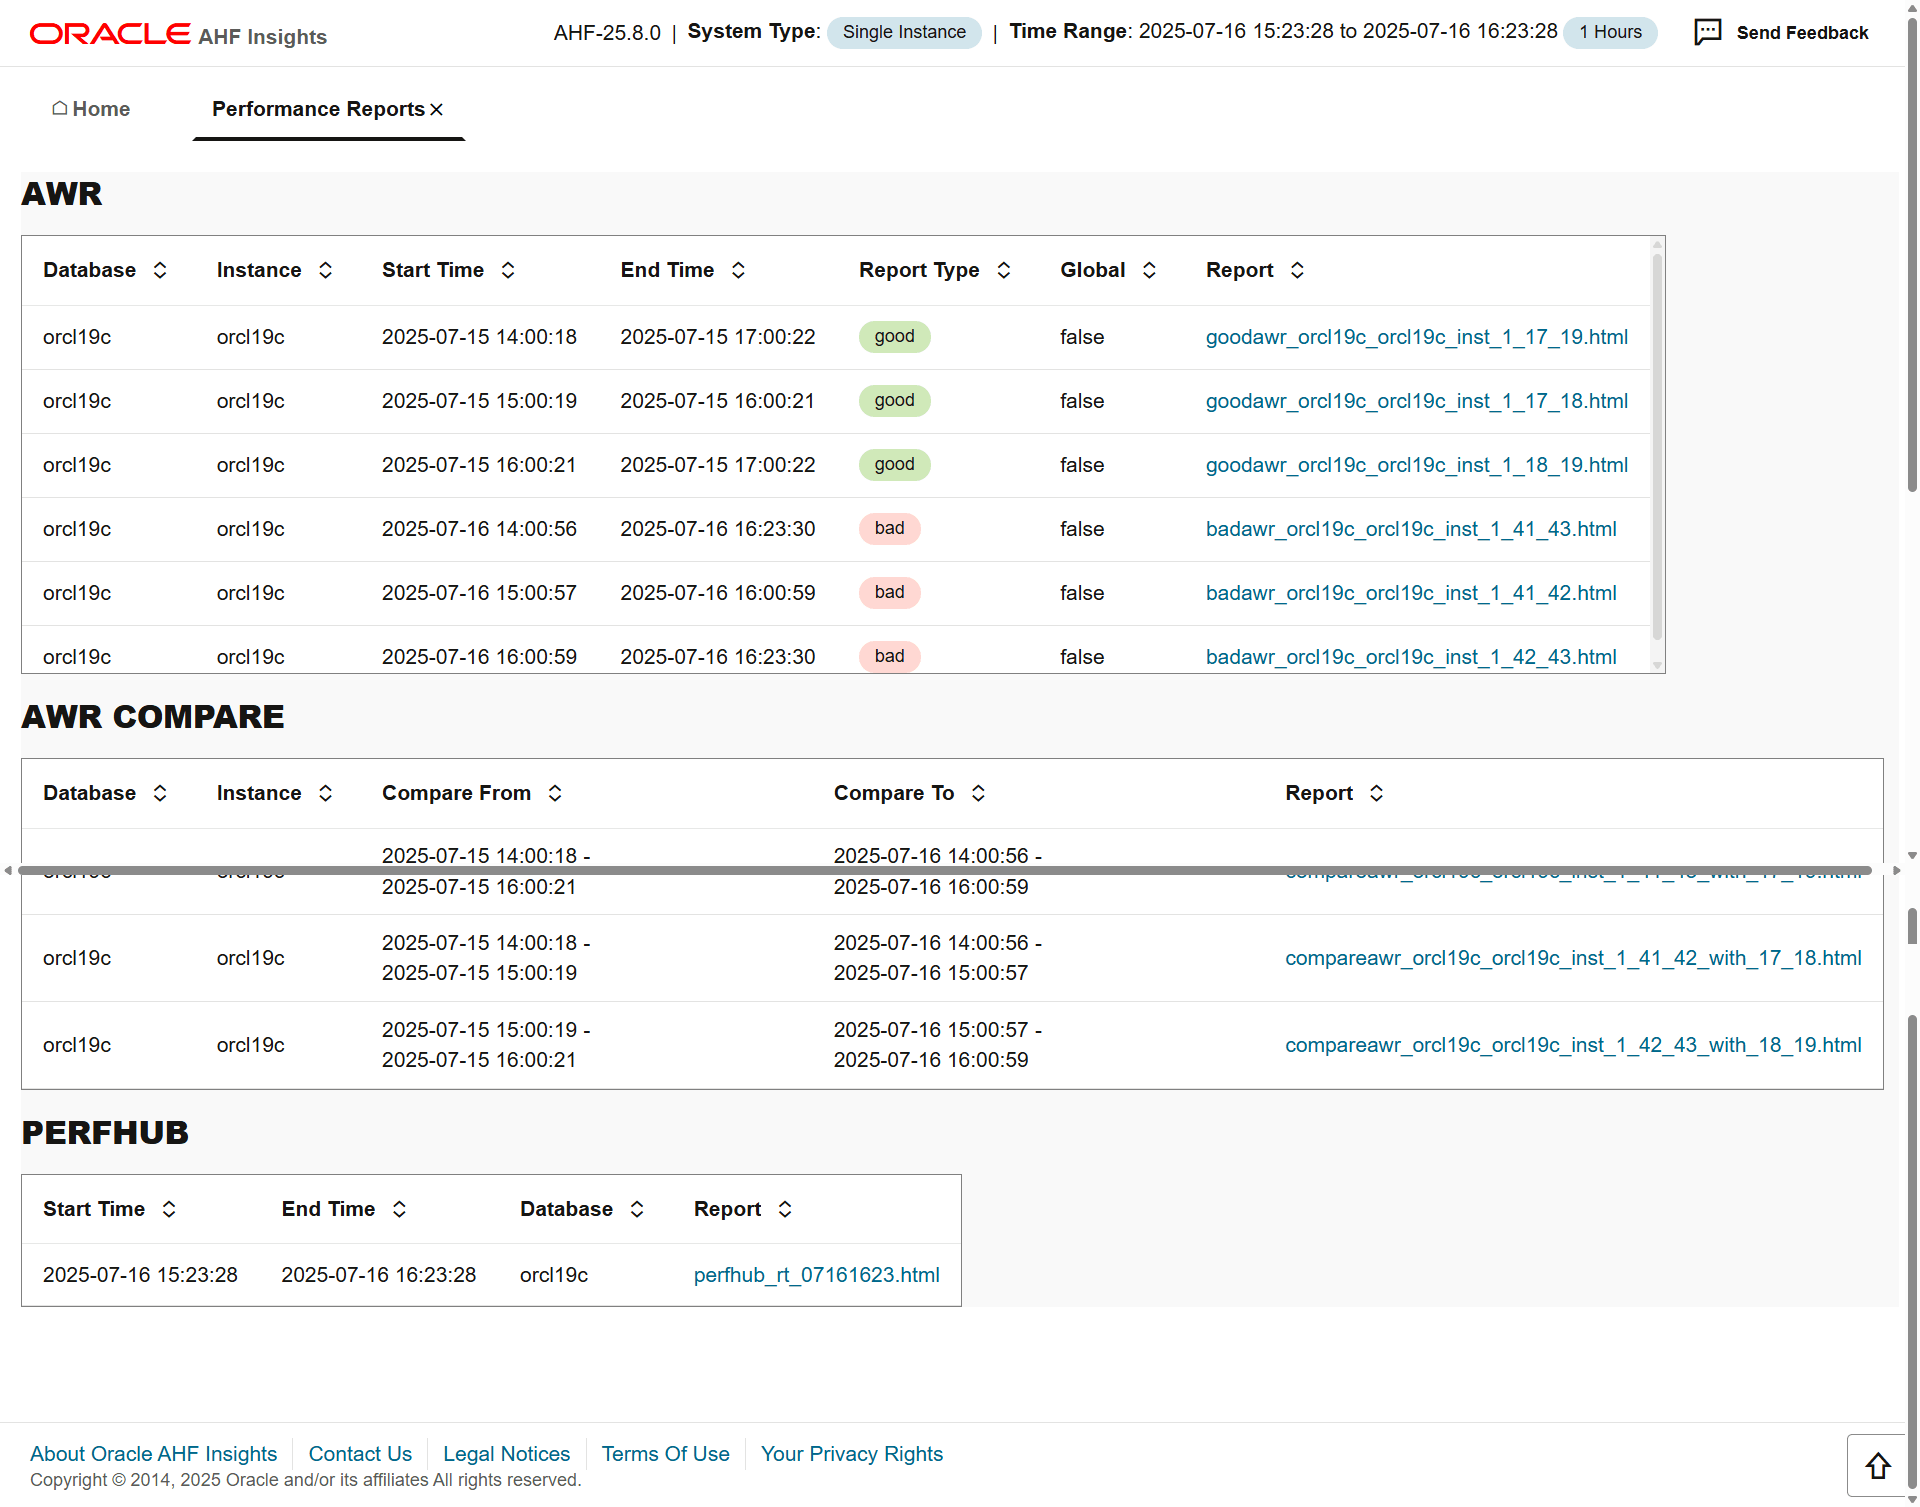
The Performance Reports section contains:
- PerfHub Reports
- AWR Reports
- AWR Compare Reports
Figure 7-52 AHF Insights - Home
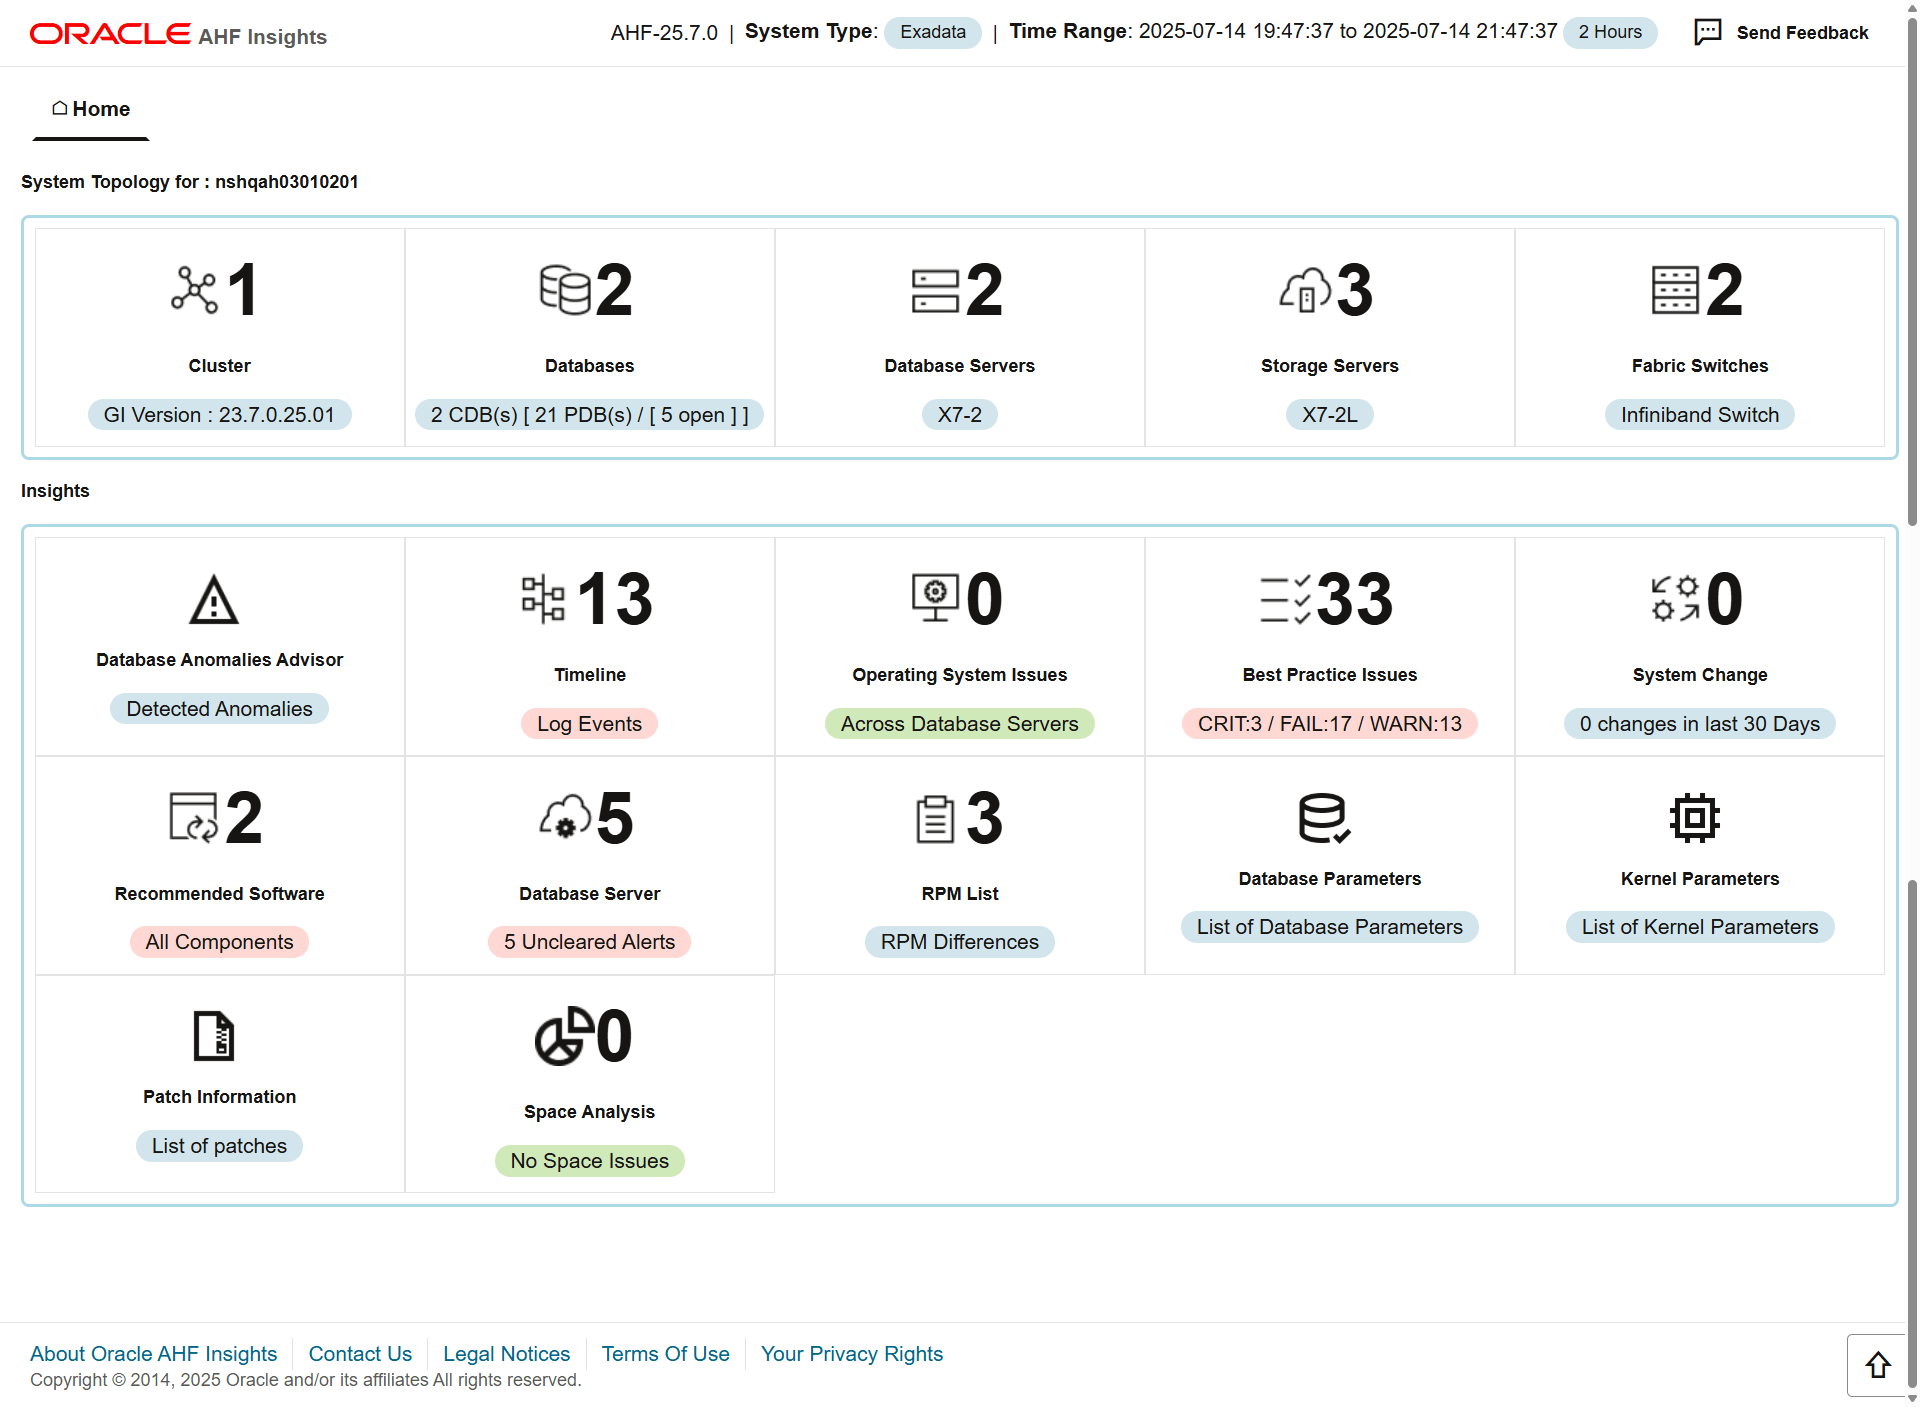
Figure 7-53 AHF Insights - Performance Reports
Open the PerfHub report.
The Database Performance Hub report gives details about the database workload.
Figure 7-54 Performance Hub
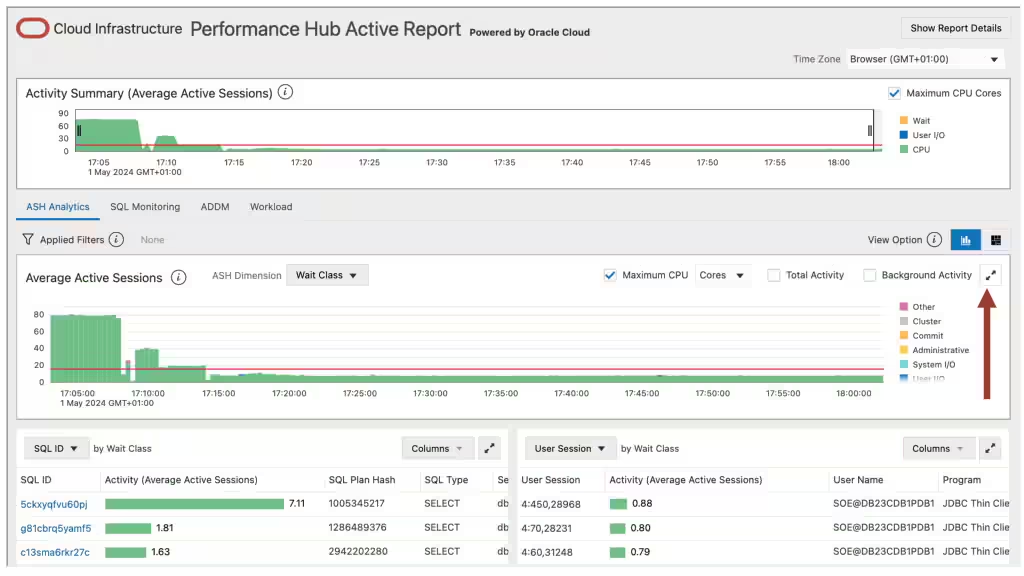
The first thing to understand is what your active sessions are doing – an active session is one actively working on behalf of the client.
By default the Performance Hub Report opens on the ASH Analytics tab.
ASH stands for Active Session History, which is a database feature that samples active database sessions.
Expand the graph to get a better look.
Here we can see our highest wait class is CPU, which tells us the database is CPU bound.
Figure 7-55 Performance Hub
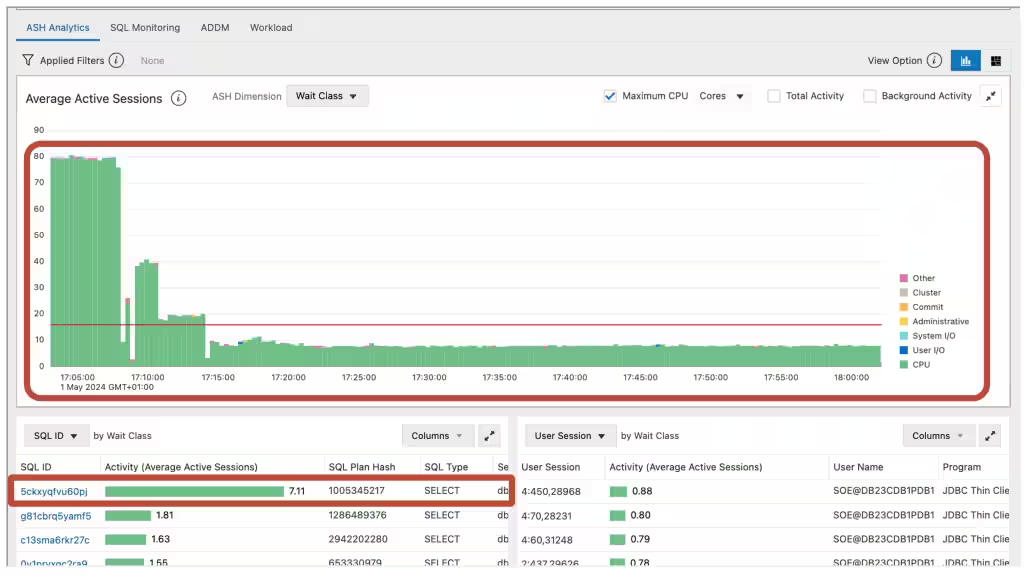
Looking at the SQL by wait class graph we can identify SQL that are candidates for tuning.
Let’s collapse the graph again and take a look at the ADDM tab
ADDM stands for Automatic Database Diagnostic Monitor.
Figure 7-56 Performance Hub
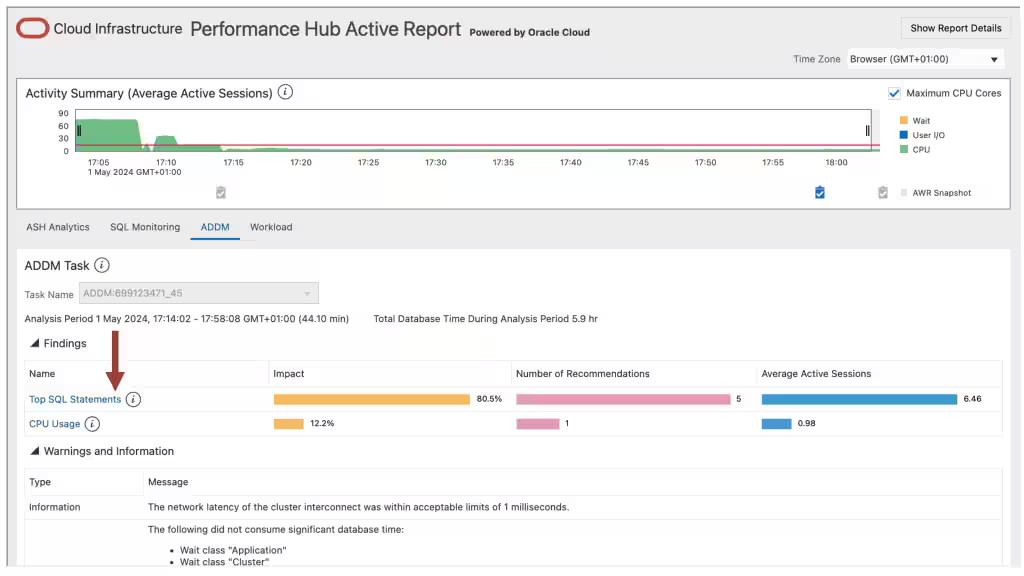
The ADDM tab analyzes the data in Automatic Workload Repository or AWR and provides options to resolve performance problems.
Click into one of the finding to get a recommendation. The recommendation will tell you what to change and give you an estimated benefit.
Figure 7-57 Performance Hub
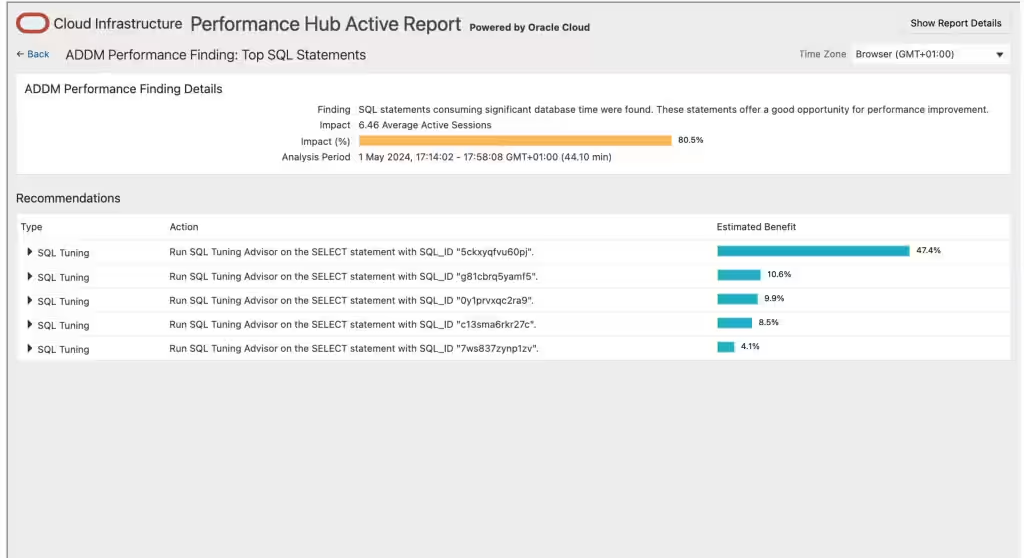
You can use this table to identify any particular SQL statements that have long running durations.
Once identified you can focus on tuning their individual performance.
For more information, see .Oracle® Database SQL Tuning Guide
Use Autonomous Health Framework to understand and protect against noisy neighbors
This third step is only applicable if you’ve had repeated database performance problems on a host with multiple other databases and the host shows periods with more than 70% CPU usage.
In this step we’ll check for noisy neighbors. In generic terms, a noisy neighbor is when one service consumes a larger than expected share of system resources, which can impact the performance of other services. Autonomous Health Framework can detect noisy database neighbors based on CPU usage.
ahf configuration set --type impact --user-name <EM user> --connect-string <EM repository connection string>You’ll be prompted for the repository password and Autonomous Health Framework will setup the configuration.
ahf configuration set --type impact --user-name ahftest --connect-string "//<a href="http://mymachine.acme.com/" rel="nofollow">mymachine.acme.com</a>:1521/<a href="http://abcd.acme.com/" rel="nofollow">abcd.acme.com</a>"

Enter EM Repository password:

Re-enter EM Repository password:

Configuration files created in /opt/oracle.ahf/data/mymachine/balance/user_johnahf analysis create --type impact --scope cluster --name cluster_nameahf analysis create --type impact --scope cluster --name mycluster
Starting analysis and collecting data for impact
Report is generated at : /opt/oracle.ahf/data/mymachine/diag/balance/user_john/cluster_160424_154432451_UTC.htmlThe first section in the report gives you a summary of your current noisy neighbor exposure and impact vs what it would be if you set the recommended CPU_COUNTs.
Figure 7-58 AHF Insights

The next graph down shows the current noisy neighbor status over the past month vs what it would have been with the recommended CPU_COUNT. Anywhere with a black line indicates a database was impacted by a noisy neighbor.
Figure 7-59 AHF Insights

As you hover over the graph these controls appear, which allow you to zoom in and pan around the data. Use this to understand if the black lines correlate with times you’ve had performance problems.
If the black lines correlate with the periods of slow database performance then use the rest of the report to drill down further by database or machine and understand the changes you need to make to CPU_COUNT across your various databases.
Log a new SR using the Autonomous Health Framework diagnostic collection
If you still need help then the final step is to log an SR using the Autonomous Health Framework diagnostic collection.
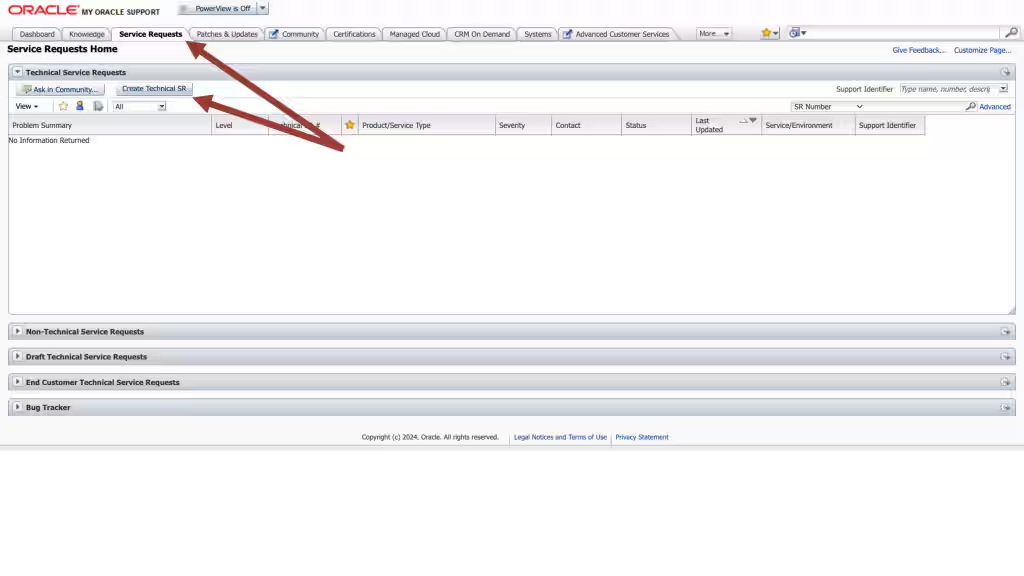
- Log into My Oracle Support.
- Choose the Service Requests tab.
- Then click the Create Technical SR button.
Figure 7-60 My Oracle Support
- Complete all the required Service Request fields.
- Make sure to choose product as "Oracle Database - Enterprise Edition"
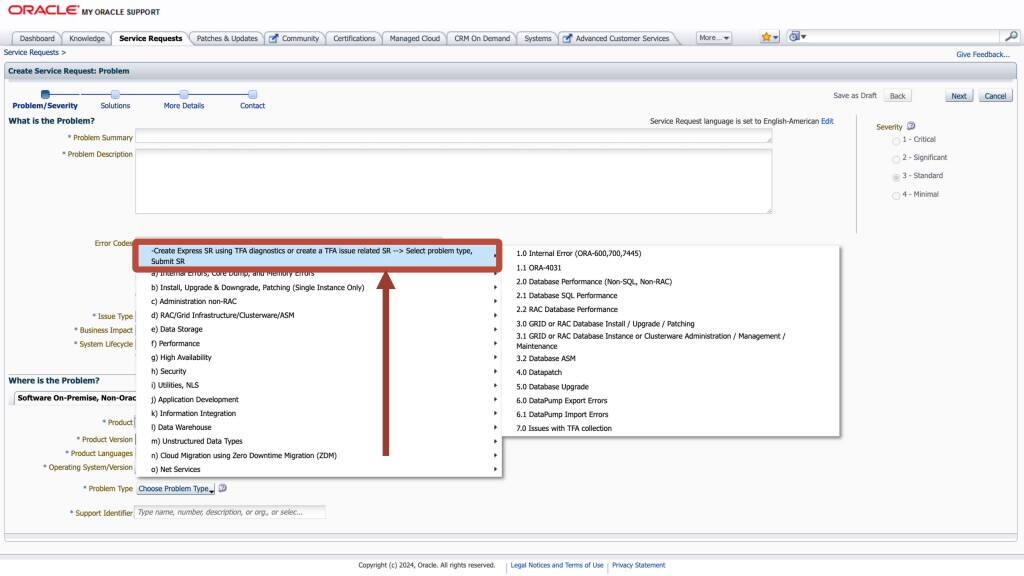
- Then when you come to the Problem Type, select the option to Create an Express SR.
This is a fast track SR creation route using an Autonomous Health Framework collection.
Figure 7-61 My Oracle Support
- Follow the rest of the steps including uploading the collection.
Oracle Support will take over and help resolve it.
Parent topic: Resolve Database Issues