oclumon analyze
Use the oclumon analyze command to analyze CHM metrics.
Syntax
oclumon analyze [-h] [-i CHM_METRICS_DIR] -o OUT_DIR [-l LOG_DIR] [--log_level {DEBUG,INFO,WARNING,ERROR}] [-s START_TIME] [-e END_TIME] [-f FORMAT] [--version]Parameters
-iCHM_METRICS_DIR,--chm_metrics_dirCHM_METRICS_DIR
Specify the directory containing CHM metrics.-oOUT_DIR,--out_dirOUT_DIR
Specify the output directory for the results.-lLOG_DIR,--log_dirLOG_DIR
Specify the log directory.--log_level {DEBUG,INFO,WARNING,ERROR}
Specify the log level.-sSTART_TIME,--start_timeSTART_TIME
Specify the start time for analysis inYYYY-MM-DDTHH:MM:SSformat.-eEND_TIME,--end_timeEND_TIME
Specify the end time for analysis inYYYY-MM-DDTHH:MM:SSformat.-fFORMAT,--formatFORMAT
Specify a comma-delimited report format (text,html). If not specified, the default format istext. Specifytext,html, or both.--version
Displays the program's version number and exits.
Example oclumon analyze Examples
To generate text analysis report for the entire CHM repository:
oclumon analyze -o /<outpur-dir>To generate text analysis report from 2024-03-14T05:00:00 to 2024-03-14T05:15:00 duration:
oclumon analyze -o /<output-dir> -s 2024-03-14T05:00:00 -e 2024-03-14T05:15:00To generate an HTML analysis report for the entire CHM repository:
oclumon analyze -o /<output-dir> -f htmlTo generate the analysis report from an archived CHM dataset:
oclumon analyze -i / -o /<output-dir>Example CHM Analysis Report
CHM analysis report contains following sections:
- Header section:
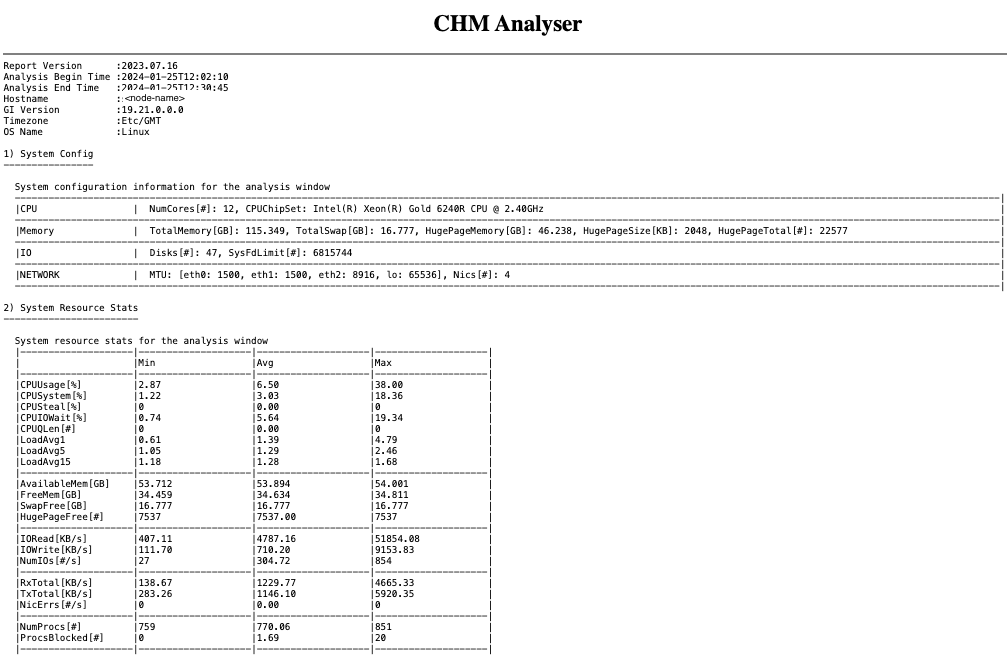
Contains info about the node, analysis time period, system configuration and system resource stats.
Figure 9-3: System Configuration and System resource stats
- Observed findings and findings summary timeline section:
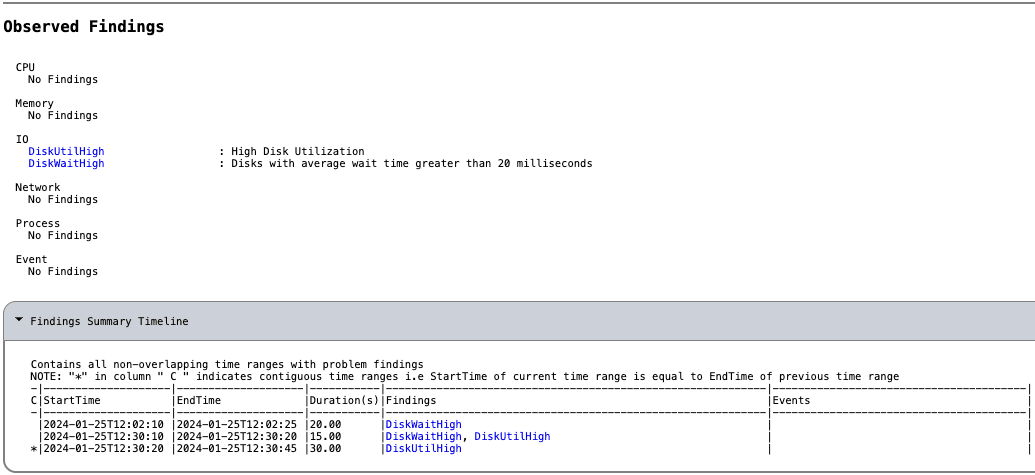
Contains the list of observed problems, along with a summary timeline of the problems.
Problematic findings and summary timeline
- Findings details section:
Contains detailed contextual information for each of the problems observed above.
Problematic findings - details
