Database Performance Tuning
For more information and videos, see https://blogs.oracle.com/database/post/database-performance-tuning.
Follow these step by step instructions to get started on your database performance tuning journey using Oracle Autonomous Health Framework.
Understanding Database Performance Tuning
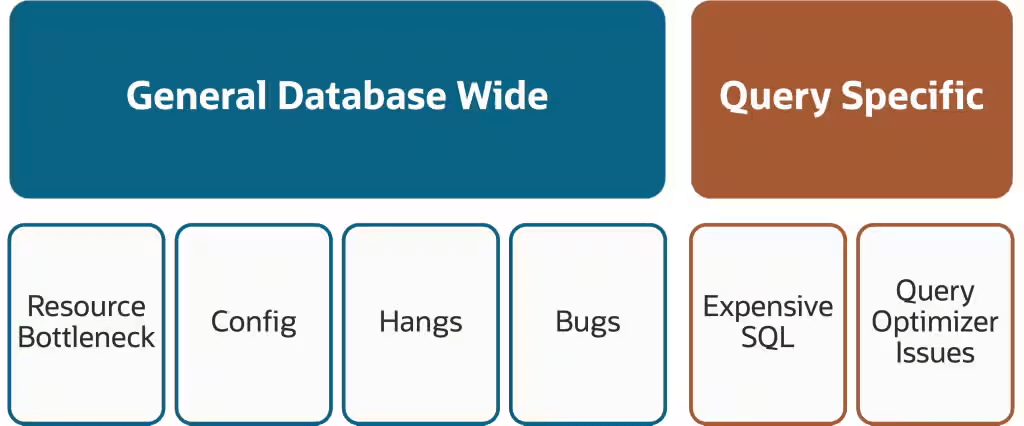
Database performance problems generally fall into two categories:
- Database-wide problems, which affect the overall database environment.
- Query-specific problems, which affect one or more SQL statements or workloads.
Database-wide problems can result from:
- CPU, I/O, memory, network, or process bottlenecks
- Database configuration issues
- Database hangs
- Software bugs
Query-specific problems can result from:
- Expensive SQL statements
- Poor query optimization
- Incorrect or missing indexes
- Outdated optimizer statistics
- Unexpected changes in execution plans
Use Oracle Autonomous Health Framework (AHF) to collect diagnostic information, analyze configuration and performance issues, investigate database workloads, identify noisy neighbors, and escalate unresolved problems to Oracle Support.
Database Performance Tuning Workflow
Use the following workflow to investigate database performance problems:
- Collect database performance diagnostics with AHF.
Use AHF Insights to:
- Compare the environment against Oracle best practices.
- Identify database anomalies and resource bottlenecks.
- Use Performance Hub reports to identify workloads and SQL statements that need tuning.
- Investigate and protect against noisy neighbors when multiple databases share the same host.
- Create a Service Request (SR) using the diagnostic collection if the issue remains unresolved.
Collect Database Performance Diagnostics
Log in to the machine where the performance problem occurred and run the following command as the oracle user:
tfactl diagcollect -srdc dbperf -database <database_name>AHF asks whether the performance problem is occurring now and collects information based on your answers.
For a current problem, AHF asks for the duration of the problem and can collect a comparison period when performance was normal. A comparison period is useful when it represents a similar workload, such as the same period on a previous day.
AHF can also ask whether SQL associated with the problem has already been identified and whether an AWR dump should be collected.
Example interaction:
$ tfactl diagcollect -srdc dbperf -database db23cdb1
Do you have a performance issue now [Y|N] [Y]: Y
Enter duration of the issue in hours [<RETURN>=1h]: 1h
As you have indicated that the performance issue is currently happening,
Performance Reports will be collected for the following periods:
Start time when the performance was bad: 2024-05-01 15:13:32
Stop time when the performance was bad: 2024-05-01 16:13:32
For comparison, it is useful to gather data from another period with similar load where problems are not seen. Typically this is likely to be the same time period on a previous day. To compare to the same time period on a previous day enter the number of days ago you wish to use. [<RETURN> to provide other time range]: 1
Start time when the performance was good 2024-04-30 15:13:32
Stop time when the performance was good 2024-04-30 16:13:32
Has any SQL been identified to contribute to the performance issue?[Y|N]: N
Do you wish to take an AWR Dump as part of this collection? [Y|N]: N
AHF collects diagnostics such as database, operating system, host, and Insights information. Depending on the environment and the answers provided, the collection can include database performance reports and additional diagnostic data.
A successful collection produces diagnostic ZIP files for the participating hosts.
Example collection summary:
.-----------------------------------------.
|            Collection Summary           |
+---------------+-----------+------+------+
| Host          | Status    | Size | Time |
+---------------+-----------+------+------+
| machine2      | Completed | 13MB | 289s |
| machine3      | Completed | 12MB | 332s |
| machine4      | Completed | 13MB | 420s |
| machine1      | Completed | 17MB | 544s |
'---------------+-----------+------+------'
AHF also generates an Insights package. Use the diagnostic package from the node where the performance problem occurred when subsequent analysis requires a node-specific collection.
Note:
Automatic Workload Repository (AWR) is a separately licensed feature. Refer to My Oracle Support for licensing information before using AWR-related functionality.
Analyze the Environment with AHF Insights
Transfer the diagnostic collection from the machine where it was created to a system with a web browser.
Extract the collection and locate the Insights ZIP file inside it. Extract the Insights archive and open the index.html file.
AHF Insights provides a consolidated view of the environment and helps identify configuration problems, resource bottlenecks, and abnormal behavior.
Compare Configuration Against Best Practices
Use the Best Practices area to identify configuration settings that differ from Oracle recommendations.
Review the summary to understand:
- The configuration areas that have deviated from recommended practices.
- The relative severity of the findings.
- The potential impact and risk.
Expand individual findings to review the recommended corrective action.
Pay particular attention to recommendations that could affect database performance.
Find Database Anomalies and Resource Bottlenecks
Use the Database Anomalies Advisor to identify unusual behavior.
AHF uses anomaly detection to identify events that might indicate performance problems and can provide recommendations for addressing them.
For example, an analysis might identify slow database or host I/O.
You can also inspect operating system information for additional evidence of resource contention.
For example, AHF might identify Oracle processes in the operating-system D state, indicating that they are waiting for I/O to complete. Disk wait times and I/O-consuming processes can provide additional evidence of an I/O bottleneck.
Review the available graphs and findings to determine:
- Which disks have high average wait times.
- Which processes consume significant I/O.
- Which periods correspond to degraded performance.
- Which snapshots contain potentially relevant performance information.
Investigate High CPU Usage
AHF Insights can also identify CPU-related anomalies.
For example, increased latency for database global cache messages can indicate a CPU bottleneck in a clustered environment.
Use the OS issues information to investigate high CPU usage.
Review:
- When CPU usage increased.
- CPU utilization over time.
- Which database foreground and background processes consumed the CPU.
- Whether the observed CPU usage aligns with the reported performance problem.
These findings can help determine whether CPU saturation contributed to the database performance issue.
Use Performance Hub Reports
AHF Insights includes database performance reports that can help identify workloads and SQL statements that require tuning.
The Performance Reports section can include:
- PerfHub reports
- AWR reports
- AWR Compare reports
Open a PerfHub report to investigate database workload activity.
Review Active Session History
The Database Performance Hub provides information about active database sessions.
The report opens on the ASH Analytics tab by default.
Active Session History (ASH) samples active database sessions and provides information about where database sessions spend their time.
Review the ASH data to determine the dominant wait class.
For example, if CPU is the dominant wait class, the database might be CPU bound.
Use the SQL-by-wait-class information to identify SQL statements that are candidates for tuning.
Review ADDM Findings
Open the ADDM tab to review findings from the Automatic Database Diagnostic Monitor (ADDM).
ADDM analyzes information from the Automatic Workload Repository (AWR) and provides recommendations for addressing detected performance problems.
Select a finding to view:
- The identified performance problem.
- The recommended corrective action.
- The estimated benefit of the recommendation.
Use the SQL information to identify statements with long execution times or other indicators of poor performance.
After identifying problematic SQL, investigate and tune the statements individually.
For additional information, see the Oracle Database SQL Tuning Guide.
Identify and Protect Against Noisy Neighbors
This step is applicable when:
- Multiple databases share the same host.
- Database performance problems occur repeatedly.
- The host experiences periods of high CPU utilization, such as more than 70%.
A noisy neighbor is a database or service that consumes more system resources than expected and consequently affects the performance of other databases or services on the same host.
AHF can analyze CPU usage to identify databases that might be acting as noisy neighbors.
Configure the Enterprise Manager Repository
AHF uses historical information from the Oracle Enterprise Manager repository when performing noisy-neighbor analysis.
Configure the repository connection as follows:
ahf configuration set \
  --type impact \
  --user-name <EM user> \
  --connect-string <EM repository connection string>
AHF prompts you for the Enterprise Manager repository password.
Example:
ahf configuration set \
  --type impact \
  --user-name ahftest \
  --connect-string "//mymachine.acme.com:1521/abcd.acme.com"

Enter EM Repository password:
Re-enter EM Repository password:

Configuration files created in /opt/oracle.ahf/data/mymachine/balance/user_john
Generate the Cluster Impact Analysis
After configuring the Enterprise Manager repository, generate the cluster analysis:
ahf analysis create \
  --type impact \
  --scope cluster \
  --name <cluster_name>
Example:
ahf analysis create \
  --type impact \
  --scope cluster \
  --name mycluster

Starting analysis and collecting data for impact

Report is generated at:
/opt/oracle.ahf/data/mymachine/diag/balance/user_john/cluster_160424_154432451_UTC.html
The resulting report provides information about current noisy-neighbor exposure and the potential impact of using the recommended CPU_COUNT settings.
Review the report to understand:
- Current noisy-neighbor impact.
- Historical periods when databases were affected.
- The difference between the current configuration and the recommended
CPU_COUNTvalues. - Which databases or hosts contribute to the observed impact.
Correlate the reported noisy-neighbor periods with the times when database performance degraded.
If the periods align, use the remaining analysis to identify the databases and machines that require CPU_COUNT changes.
Create a Service Request
If the performance problem remains unresolved, create a Service Request using the AHF diagnostic collection.
- Sign in to My Oracle Support.
- Open the Service Requests area.
- Select Create Technical SR.
- Complete the required Service Request fields.
For the product, select:
Oracle Database - Enterprise Edition- For the problem type, select the option to create an Express SR.
Express SR provides a streamlined Service Request workflow that uses an AHF diagnostic collection.
- Upload the AHF diagnostic collection as part of the Service Request.
Oracle Support can then use the diagnostic collection to investigate the remaining performance problem.